Imagine if you could predict how much revenue you’re due to bring in on a monthly, quarterly or even yearly basis? With predictable revenue models in place, you can.
B2B marketers and sales teams work hard to drive their key goals. But they’re not the same goals.
While sales work to close deals, marketers tend to work to drive leads. This misalignment results in a whole plethora of problems when it comes to tools, reporting, collaboration and ultimately, results.
Related: Read the guide to sales and marketing alignment and how you can achieve it
By putting revenue at the heart of your marketing, you can find a formula that works for you to repeat and scale success.
Keep reading to learn:
- What predictable revenue is and what it does
- Why predictable revenue is important
- What predictable pipeline is
- How to achieve predictable revenue
Let’s get started.
What does predictable revenue do?
Predictable revenue is a framework that allows businesses to repeat and then scale revenue on a consistent basis.
The phrase originated from Aaron Ross and Marylou Tyler’s best-selling book, Predictable Revenue: Turn Your Business into a Sales Machine. Targeted at sales reps with limited time to spare, the book covered how businesses can create this framework to consistently grow.
Why is predictable revenue important?
Creating predictable revenue is a key goal for businesses as it ensures a set level of revenue per month, quarter and year. By knowing how much revenue you can guarantee, you can then make plans to scale and grow.
A particularly important metric for SaaS businesses, predictable revenue allows you to finetune your marketing and get more out of your input.
What is a predictable pipeline?
A predictable pipeline is a strategy where your sales and marketing teams work together to find high-quality leads that you can drive through the lead generation funnel.
Similar to predictable revenue, a predictable pipeline follows the same principle. Instead of predicting how much closed revenue you can expect, it simply segments this against your overall pipeline.
A predictable pipeline allows you to detail sales enablement for each stage of the pipeline plus maximises your marketing to promote loyalty and retention.
How to achieve predictable revenue?
According to Aaron and Marylou, you can achieve predictable revenue by doing the following:
- Understanding your funnel
- Determining an acceptable average deal size
- Defining timeframes for each stage of the funnel
They also specify that every facet of your funnel needs to become a system. Without that, you have no predictability.
Let’s go through their points one by one to explore how you can achieve each.
Understanding your lead funnel
We know that customer journeys are made up of three distinct stages; the awareness stage, the consideration stage and the decision stage. Each stage can be made up of a few or hundreds of touchpoints that work to drive a user to the next stage.
Related: Complete guide to customer journey mapping
But do you know which marketing channels are most effective in the awareness stage, and which work best at closing prospects?
Deciphering this is just one part of understanding your lead funnel.
Tracking each and every touchpoint, while a lot of data, is key to determining trends in how your marketing and sales touchpoints are working together to move people along the funnel.
For B2B marketers, this is easier said than done. When anonymous website visitors convert, many marketers struggle to link that new lead to a website session, never mind historic sessions.
The trick is to use a marketing attribution tool to link your website visits to leads and even to revenue. You’ll be able to see which marketing channels are working to drive you leads, and conversions.
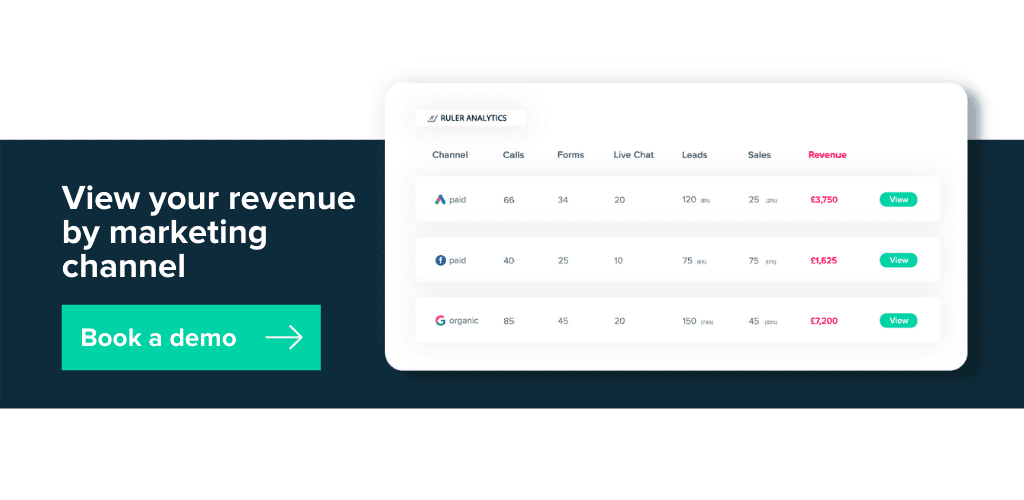
Here’s an example of the data in action in Ruler Analytics.
Remember, the key is to spot trends of what’s working. What channels are bringing you traffic and revenue from a first-click point of view? Which channels are driving revenue from a last-click perspective?
Understanding this will allow you to take a detailed look at how your lead process is currently working and the improvements you can make to it to ultimately drive more revenue.
🚀 Pro Tip
We walk you through tracking your customer journey from the awareness stage to sales. In this guide, you’ll be able to cross-reference every closed sale back to their individual marketing sessions.
Determining your average deal size
This is a bit more simple to understand. You can use your CRM or a tool like ChartMogul to understand what average revenue you’re driving. Particularly for SaaS businesses, this will be one to watch.
By understanding your average deal size, you can start to quantify how much potential revenue is sitting in your pipeline.
This data, coupled with a stronger understanding of your lead funnel and how likely users are to convert, means you can get a more analytical view of how much potential revenue is at play.
Defining timeframes for your lead funnel
Alongside data on your lead funnel stages and average deal size, you’ll also need to define timeframes for each stage of your lead funnel.
Again, this is something you can look to learn from your CRM by using clearly defined stage classifications.
By setting sales funnel stages and defining timeframes, you’ll be able to add a probability counter to your leads.
Essentially, if you know that your leads tend to convert into a sale within 90 days, then those that take longer are going to have a smaller likelihood of converting.
Aligning this data means you can merge data on revenue, time and lead quality to get a better understanding of your predictable revenue and how much is in the pipeline.
🚀 Pro Tip
Remember, Ruler Analytics offers an opportunity pipeline feature that will attribute leads and sales to the corresponding sales funnel stage. Find out more about it by booking a demo with the team.
Wrapping up
The goal for marketing and sales teams should be to work together to drive more revenue. Sadly, the teams have historically sat very separately meaning they don’t share goals, KPIs, processes or tools.
By streamlining these, you can start to push the teams towards the same goal.
And remember, a marketing attribution tool can take a lot of the hard work out of defining predictable revenue. With an attribution tool in place, you can see how much revenue you’re generating through particular campaigns and channels. From there, you can easily optimise your outputs.
And, since your data is connected thanks to Ruler Analytics, you can easily see how much revenue is in the pot and how much is in the pipeline.
Find out more about how Ruler works by downloading our guide to closed-loop marketing attribution. This is the model we use to connect your closed sales data back to your marketing. Or, start viewing your revenue by marketing channel and make data-driven decisions that will help you optimise your resources.