Create a single view of your cost data in Google Analytics and analyse your advertising campaigns on LinkedIn, Facebook and other sources in a few simple clicks.
By the end of this guide, you’ll gain the skills, knowledge and confidence to upload cost data into Google Analytics and become better equipped to calculate ROI and ROAS across all your advertising channels.
For this article, we’ll discuss:
- What is cost data in Google Analytics
- How to import cost data in Google Analytics
- How to close the loop between your marketing spend and ROI
💡 Pro Tip
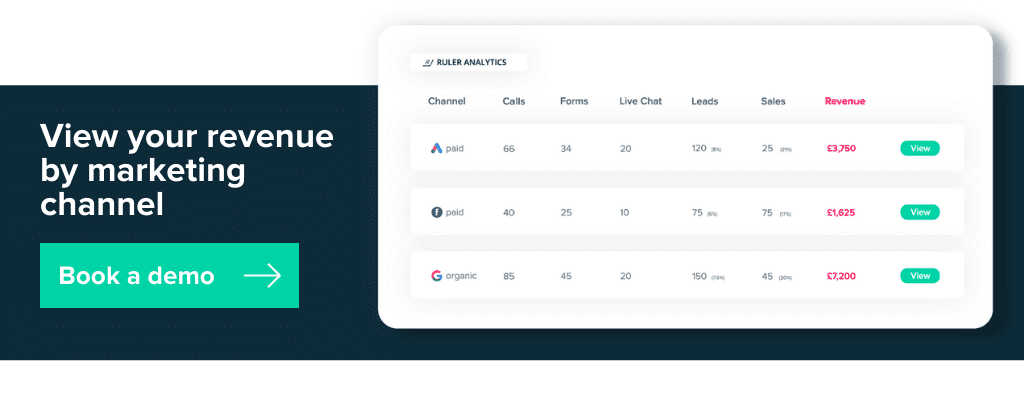
Ruler breaks down the barrier between marketing and sales by identifying which channels contribute the most revenue, not just clicks and conversions. It attributes revenue data from your CRM to your marketing channels, allowing you to calculate your ROI more accurately.
How Ruler attributes revenue to your marketing
What is cost data in Google Analytics?
Google Analytics allows you to import and analyse costs from non-Google ad campaigns.
Take Facebook ads, for example.
You can upload the cost and performance data from Facebook to track how each advertising campaign is working to drive traffic and conversions to your website.
You can compare the performance of all your online advertising campaigns across multiple channels in a single report and make better decisions to improve your ROI and ROAS.
Where is the cost analytics report in Google Analytics?
To find the cost analysis report in Google Analytics, go to the main view and select Acquisition > Campaigns > Cost Analysis.
Below is what you can expect to find in Google Analytics if you’re not already importing your cost data.
By default, your data from Google Ads should already be available in Analytics.
That’s assuming you’re running Google Ads and have linked your account to your Analytics property. Third-party platforms such as Facebook, Instagram and other sources won’t have any specified cost data (yet).
How to import cost data into Google Analytics 4
To pull in data from other advertising platforms, you’ll need to set up data importing, and you can achieve this by following the steps below.
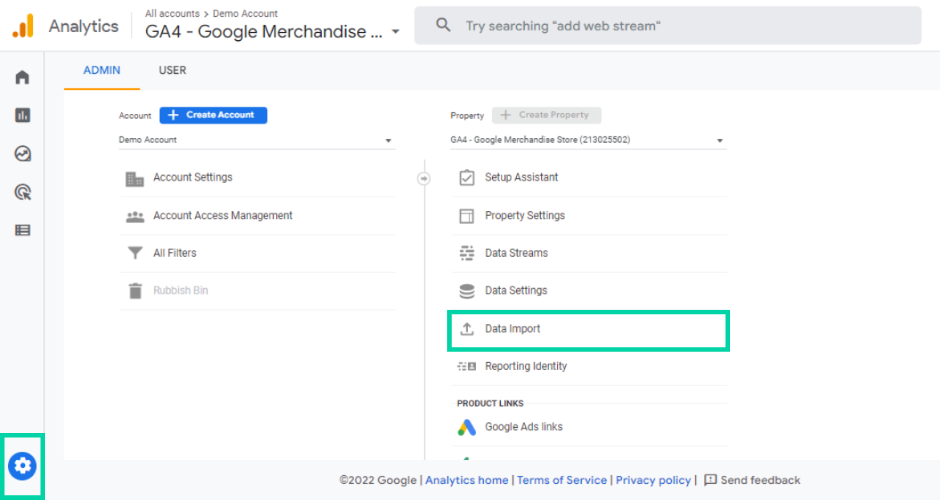
1. Log into your Google Analytics account, click on ‘Admin’ and go to ‘Data Import’.
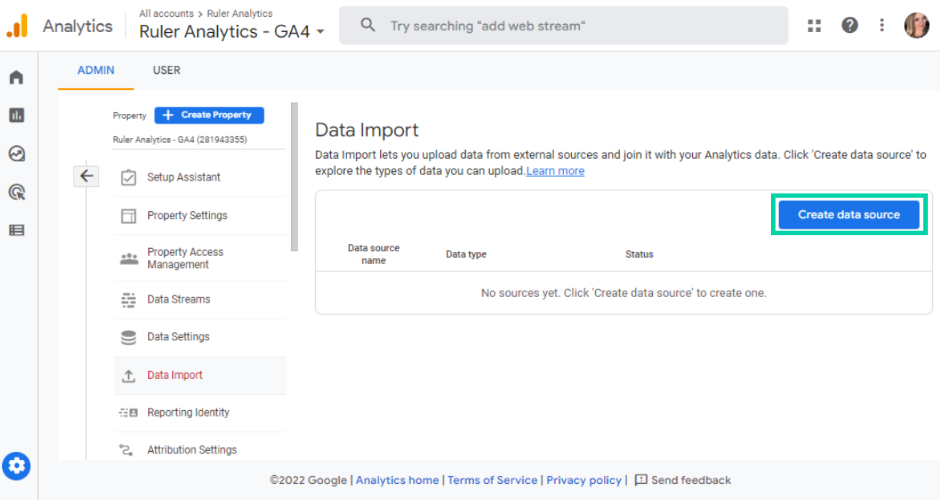
2. Click on ‘Create data source’.
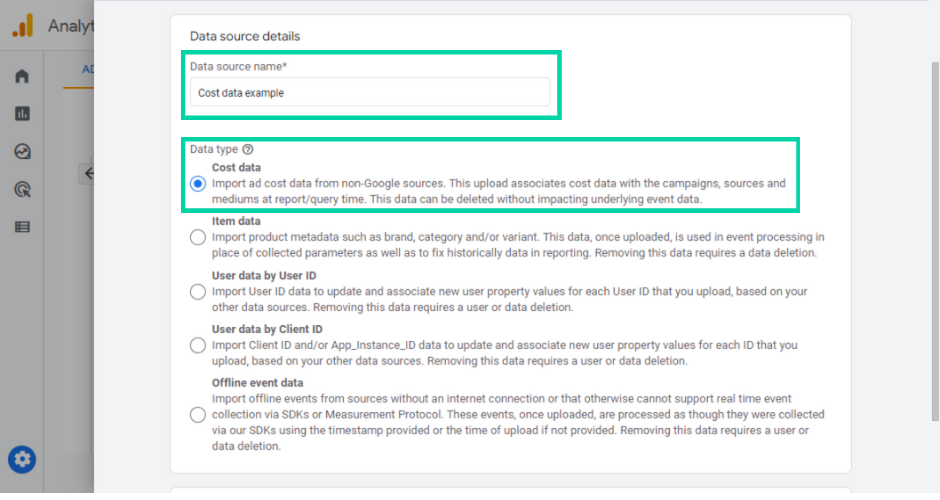
3. Name your data source. You’ll also see various data types to import extra information based on products, User ID and Client ID. For this example, we’re going to choose ‘Cost Data’.
4. Now, it’s time to set up your data schema. You’ll need to provide some information in your .csv about your ad campaigns so that Google Analytics can accurately match up the data in your reports. This data includes the date, medium, and source. Google Analytics has a template that you can use to format your cost data.
5. Once you’ve formatted your cost data, upload your data for import using the “Upload CSV” option and click “Next”
6. Now it’s time to map the data in your CSV file with each corresponding field in Google Analytics. Tick each field that you want to import into Google Analytics.
7. Once you’ve successfully mapped your data, you’re ready to upload your cost data. Click on “Import” in the top right corner to get started. Depending on the size of your CSV file, it can take some time to upload and process.
8. When the upload is complete, you’ll see a green tick under “Status”.
If successful, your data should be available in the “Acquisition Report” and under the “Cost Analysis” tab. Please note that the cost can take up to 24-hours to display in Google Analytics.
Closing the loop between marketing spend and return on investment
The cost data feature lets you upload extra information to improve your reports and better track your returns, but Google Analytics isn’t perfect.
Google Analytics can’t track full customer journeys.
It can track how many visitors have landed on your website and record conversions.
But there’s no information on what happens afterwards.
You can’t see how your visitors in Google Analytics impact later stages in the funnel, making the process of tracking ROI a bit tricky.
One of the key benefits of Ruler Analytics is its ability to match lead generation activity such as web forms, phone calls or live chat enquiries directly with CRM revenue.
Ruler’s ‘Cost In’ feature allows you to close the loop between marketing spend and return on investment.
You can add your campaign costs straight from your marketing channels into Ruler and quickly determine which campaigns are working to drive the most revenue for your business.
First, let’s take a look at how Ruler closes the loop between your marketing spend and return on investment.
Afterwards, we’ll show you how to upload cost data into the Ruler dashboard.
- First, Ruler tracks each anonymous visitor individually and records how each user found your site. Ruler can also track any subsequent visits to, or interactions with, other marketing channels and campaigns.
- When that user converts into a lead, whether that’s by phone, form or live chat, Ruler sends all of the data held on that individual over to your CRM. In your CRM, you’ll be able to track the source of your leads against the revenue value.
- When a sale or deal is closed in the CRM, Ruler will map the revenue back to the marketing source, campaigns, keywords or landing pages in Analytics, allowing you to measure the lifetime value and customer acquisition costs of your marketing sources and accurately calculate your return on investment.
- Ruler can send CRM revenue data into your favourite marketing apps too. This includes Google Analytics and other ad tools, including Facebook, Microsoft, and Google Ads. By importing cost data into Google Analytics and CRM revenue data from Ruler Analytics, marketers can gauge how their investments are generating income and make smarter decisions to optimise their marketing spend.
💡 Pro Tip
Want to know more about Ruler Analytics, but not ready to book a demo? Read our blog on everything Ruler can do and see how it can boost the quality of your marketing measurement and ROI.
Everything you can discover in Ruler
Importing cost data into Ruler Analytics
Ruler allows you to upload marketing channel costs from platforms that have an API integration such as Bing and Google Ads. Below is an example of how Ruler connects paid keyword cost data straight from Google Ads.
- Log into Google Ads and navigate to your paid ‘Keywords Report’.
- Click the ‘Download‘ button. When downloading ensure you import this as a ‘CSV‘ format.
Important Note
When exporting data ensure your campaign, ad group and keyword status is set to all rather than ‘all enabled’. ‘All Enabled’ will not include any campaigns that have been paused during this period. You will need to do this at each level to ensure your export includes all relevant data.
- Import your downloaded CSV straight into your Ruler dashboard via the Imports feature. You can find this in Ruler via Settings > Imports Select Google Ads as your CSV formatting.
Ready to combine your cost data with revenue to calculate your ROI and ROAS?
Uploading your cost data in a single system like Google Analytics allows you to measure your traditional metrics against your marketing spend.
And, with the help of Ruler, you can automatically pass conversion and CRM revenue data into Google Analytics and become better equipped to measure metrics more meaningful to your business, such as return on investment, return on ad spend and more.
Have any questions about the Ruler cost-in or closed-loop marketing attribution features?
See how Ruler attributes revenue to your marketing or feel free to get in touch with a member of the team.
You can book a demo with one of our sales representatives, or we have agents waiting to answer your questions via our live chat.