
Effective budget allocation depends on having a clear understanding of which marketing activities are generating measurable business outcomes.
For ecommerce brands managing campaigns across numerous paid channels, achieving that clarity can be challenging. Attribution data is often fragmented, multiple platforms claim credit for the same conversions, and reporting metrics do not always align with revenue performance.
As a result, marketing teams can struggle to make confident investment decisions based on the data available to them.
This was the challenge facing one B2C ecommerce brand.
By partnering with Ruler to deploy a combined multi-touch attribution and marketing mix modelling solution, they replaced a fragmented, platform-dependent view of their marketing with something far more useful, a single, deduplicated picture of what each channel was genuinely contributing and what the portfolio as a whole could sustain.
The result wasn’t just better reporting. It was better decisions, at the channel level, at the budget level, and at the moments that mattered most.
The measurement challenge
The client had built a sophisticated channel mix, spanning Meta prospecting and remarketing, Google Shopping, Performance Max, Demand Gen, Display, Pinterest, Instagram, and Spotify, and had reached the point where growth required conviction, not guesswork.
The friction surfaced most visibly with Meta. Target ROAS bidding was returning numbers that looked healthy on the dashboard, but the bottom-line economics didn’t fully align.
Meta’s algorithm, optimising toward its own reported conversions, was regularly claiming credit for purchases that had been influenced, or outright initiated, by other channels entirely. The result was algorithmic bidding anchored to a number that didn’t reflect reality.
Compounding this, new and returning customers were flowing into the same revenue bucket. Without that separation, the business couldn’t distinguish between channels that were genuinely pulling in fresh demand and those that were efficiently recycling an existing base, a critical difference when evaluating the true cost of growth.
However, the bigger challenge sat offline. A meaningful share of the brand’s revenue didn’t touch the website in the way a standard pixel expects. Phone-based sales, orders placed by customers who’d seen an ad, browsed the site, and then picked up the phone, were completing outside the digital tracking loop entirely.
With no cookie or click ID available, conventional attribution models had no reliable way to connect marketing exposure to the eventual transaction.
Amazon added another layer of complexity. A portion of customers were converting on Amazon’s platform rather than the brand’s own storefront, again, beyond the reach of any pixel or session-based tracking.
With no mechanism to draw that thread back to the originating channel, the business was effectively blind to how much demand was being generated upstream and which marketing activity was actually driving those Amazon sales.
The solution
Ruler provides a measurement framework designed to reflect how the client’s customers actually buy, rather than how any single platform preferred to count them.
First party multi-touch attribution & offline conversions
First-party tracking replaced reliance on platform-reported data entirely. Ruler’s tracking layer captured behaviour independently, tying individual user journeys to real outcomes through first-party, privacy-compliant identifiers that sat outside any single ad platform’s ecosystem.
This alone began to dissolve the discrepancies between what the dashboards were reporting and what the business was actually seeing at the margin.
Multi-touch attribution (MTA) was then applied to direct ecommerce transactions, the purchases completed on the brand’s own storefront. Rather than assigning the entirety of a sale to the last click or the most recent touchpoint, MTA distributed credit across the full purchase journey.
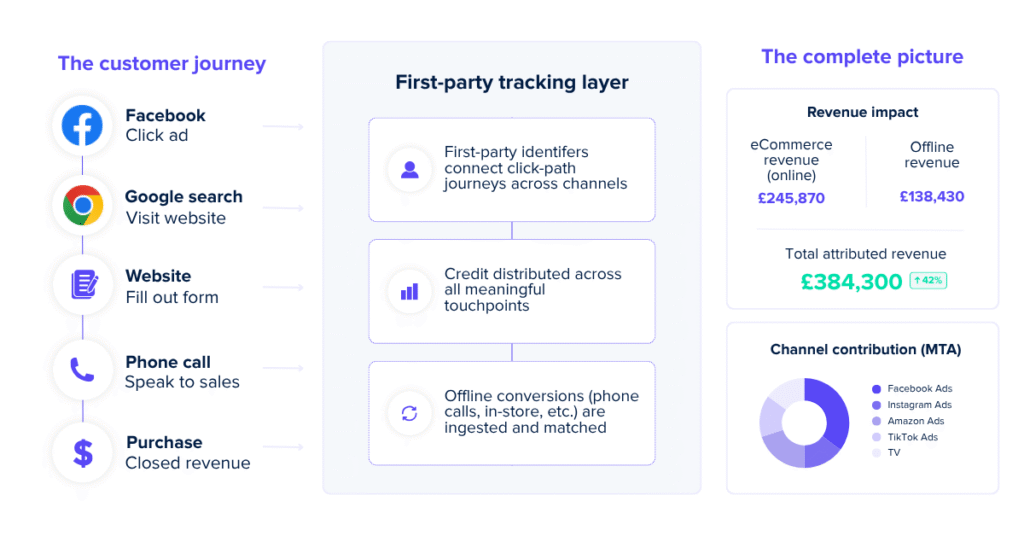
By ingesting offline sales data from the CRM, Ruler also closed the offline blind spot. Phone-based sales, where a customer had engaged with paid media, visited the site, and then completed their purchase over the phone, were connected back to their originating touchpoints through CRM data.
Call records were matched against known user journeys, allowing revenue that had previously vanished from the tracking picture to be reattributed to the channels that had driven it.
For the first time, the team could see what their paid media was genuinely contributing to phone revenue, not just web revenue.
Marketing mix modelling
Marketing mix modelling handled what individual-level tracking couldn’t, the macro view.
As Amazon conversions sit entirely outside the brand’s own tracking environment, they required a modelling approach rather than a deterministic one. MMM ingested spend data, external variables, seasonality, market conditions, promotional activity, and revenue outcomes across all channels, including Amazon, to statistically isolate the contribution of each.
Rather than guessing at Amazon’s relationship to paid media, the model quantified it.
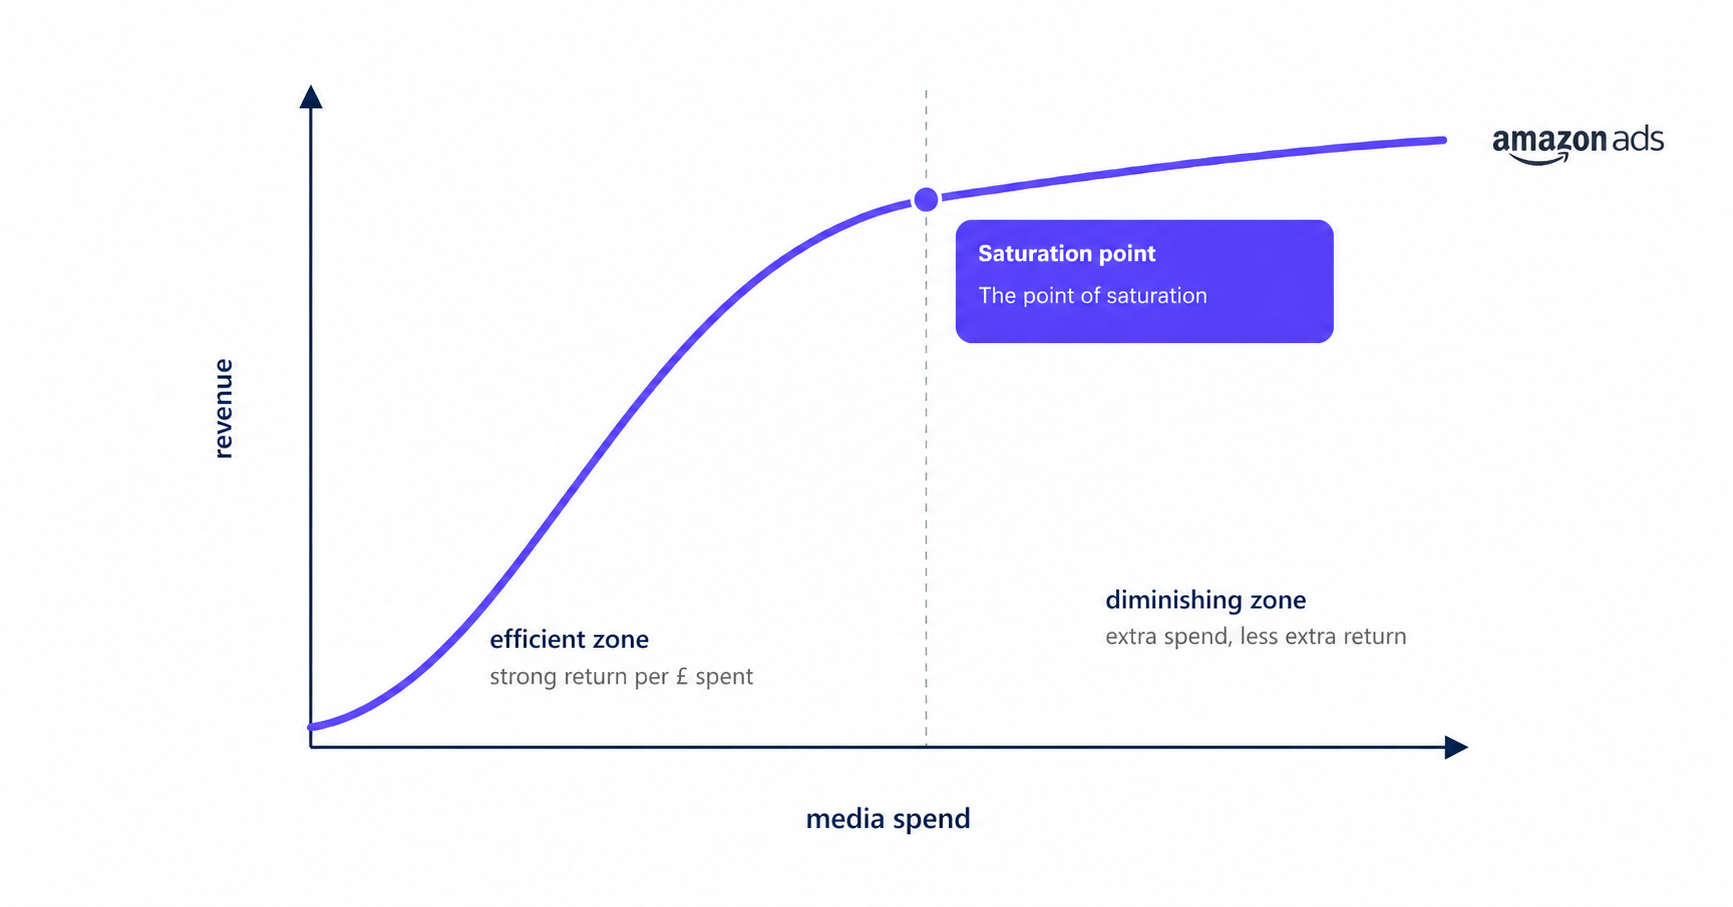
However, MMM’s value extended well beyond closing the Amazon gap. As the model is built on statistical response curves rather than last-touch logic, it inherently captures the relationship between spend and return at every level of investment, including where that relationship starts to bend, allowing the team to see where incremental efficiency begins to decline.
For each channel, the model plots how revenue responds as budget increases, and crucially, where incremental spend begins to yield diminishing returns. That curve is where Marginal ROAS lives.
Unified, deduplicated view of performance
Crucially, deduplication ran across ecommerce, CRM and Amazon revenue, removing duplicated credit and creating a single source of truth for performance.
This gave the team a complete view of revenue across the brand’s own storefront, offline sales captured in the CRM, and Amazon marketplace transactions, all measured within one framework rather than split across disconnected platform reports.
For a business where a meaningful share of revenue completed away from the website, this was a significant shift. Phone sales and Amazon conversions, previously absent from paid media reporting, could now be measured alongside onsite transactions without inflating channel performance through duplicate attribution.
New customer acquisition and repeat purchases were also segmented throughout, allowing the team to evaluate not just the volume of revenue each channel drove, but the quality of it. This made it easier to distinguish between channels growing the customer base and those retaining existing customer
The results
Over a two-year measurement window, the full channel portfolio generated over £900,000 in revenue against roughly £390,000 in spend, a blended ROAS above 4x and a Marginal ROAS of approximately 2x. For the first time, that figure included phone sales and Amazon conversions alongside direct ecommerce, all deduplicated into a single view.
Facebook Paid Prospecting was the single largest revenue driver, accounting for roughly a third of total revenue. Its ROAS looks modest in isolation, but within a deduplicated model it represented genuine incremental contribution, a very different number to what Meta’s own dashboard had been reporting.
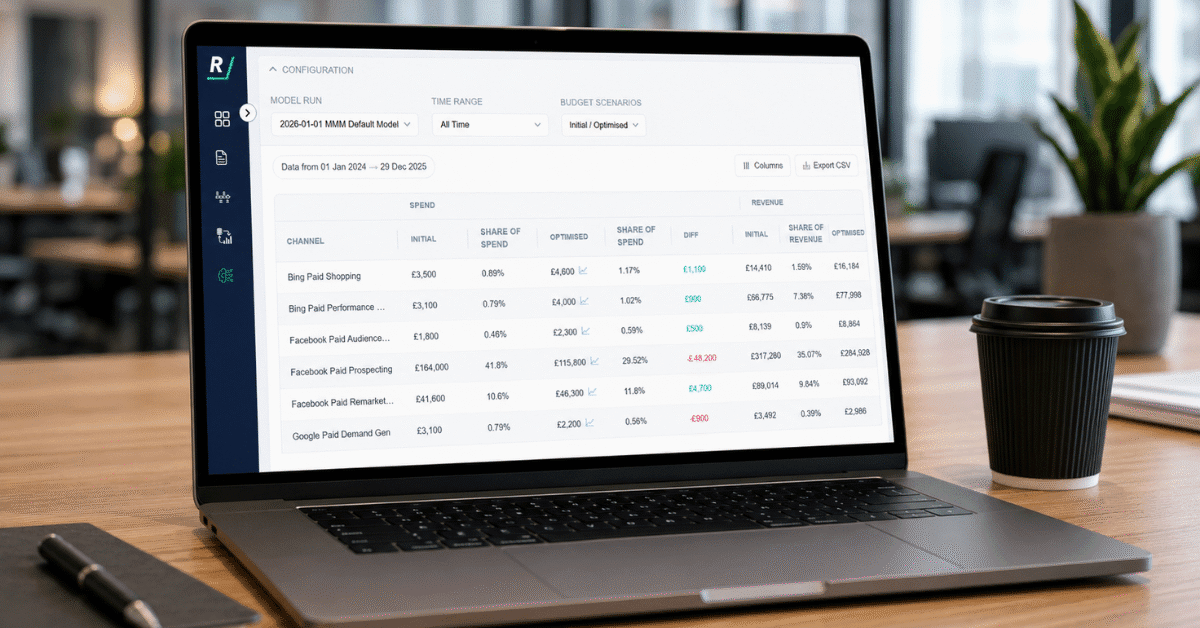
Google Performance Max flagged a Marginal ROAS approaching 1x, signalling a channel nearing its efficiency ceiling. Google Demand Gen and Display showed clear saturation. Meanwhile, Pinterest delivered consistent, efficient results with high weekly coverage and genuine headroom for additional spend. The Budget Scenario Planner translated all of this into a channel-by-channel map that turned Q4 allocation from instinct into evidence.
Ready to build your unified view
Once online and offline revenue sat in the same measurement framework, the conversation changed. Budget decisions stopped revolving around platform narratives and started reflecting actual incrementality.
Channels that once looked inflated were rebalanced, and channels that looked underperforming in isolation were understood in context. And for the first time, offline conversions, such as Amazon and phone sales, were treated as part of the same demand system, not separate reporting problems.
If you want to see how this approach could work in your own setup, book a demo with Ruler. We’ll walk through how a unified measurement framework can connect your online and offline data, remove duplication in conversion reporting, and give you a clearer, revenue-led view of performance so you can make more confident budget decisions across every channel.
This work shows what changes when marketing data is brought out of silos and tied back to real revenue. Book a demo with Ruler to explore unified attribution and marketing mix modelling for your own channel mix.
Book a demo Learn more