
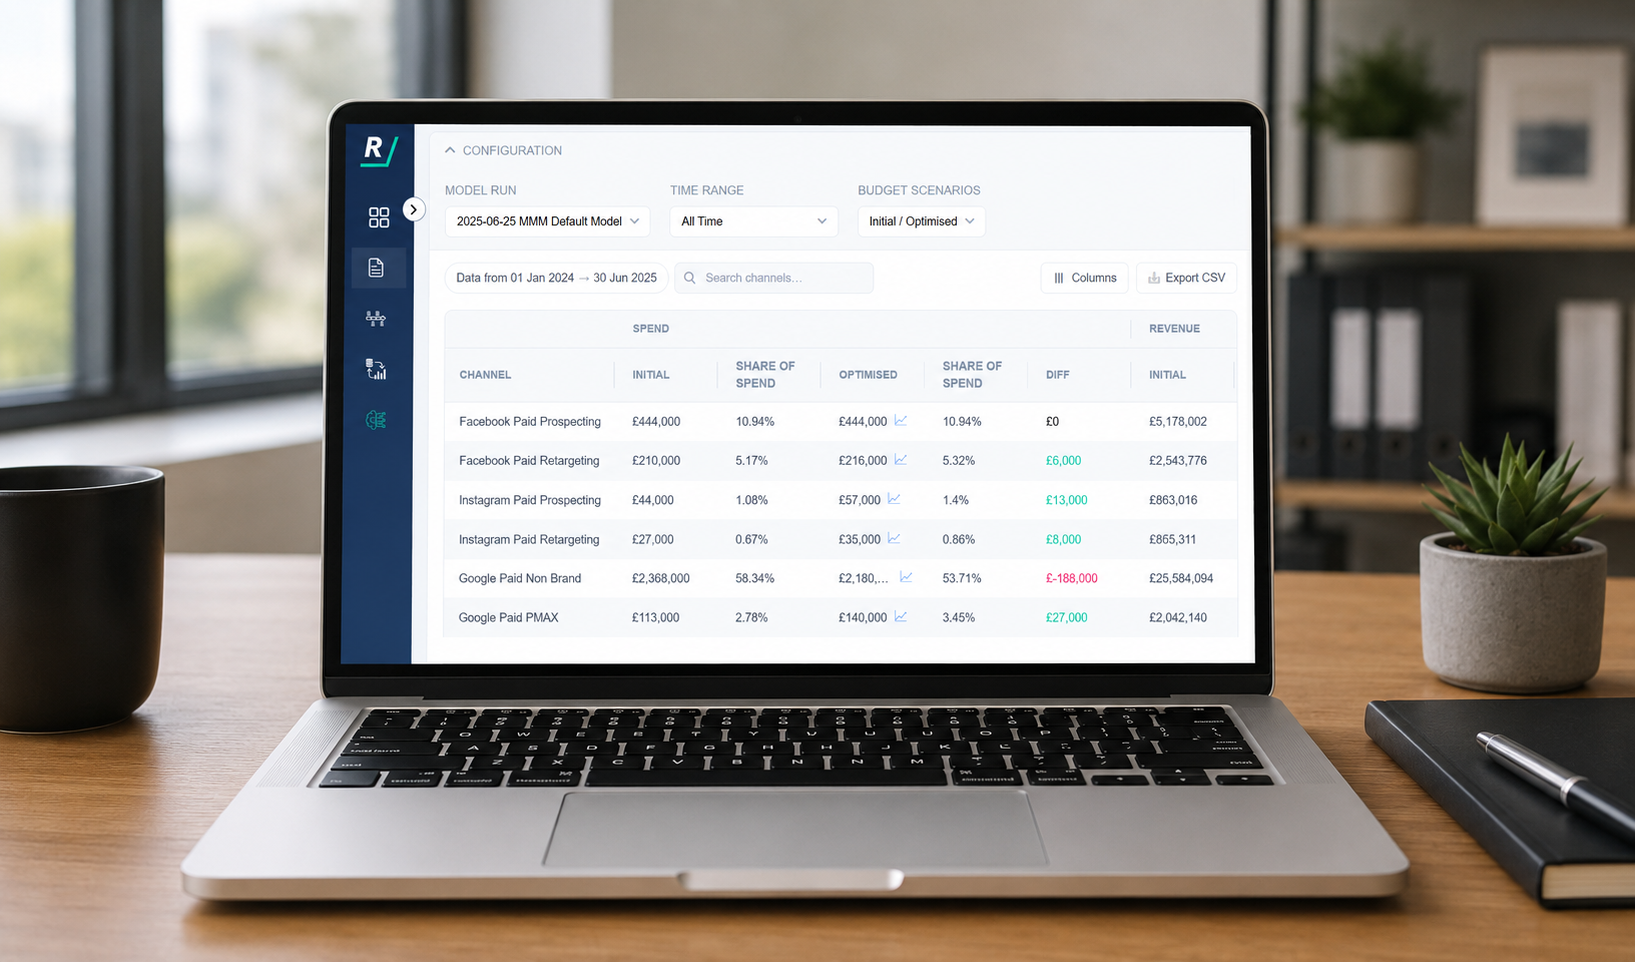
A common challenge for businesses operating with a B2C lead generation model, is accurately measuring the impact of marketing investment on both website and in-store revenue.
Many organisations rely on analytics tools, ad platforms, and internal CRM systems each providing a different view of performance.
These data sources are often incomplete or contain duplicated revenue due to multi-touch customer journeys. As a result, businesses face inconsistent reporting and reduced confidence in decision-making, leading to cautious investment and limited growth.
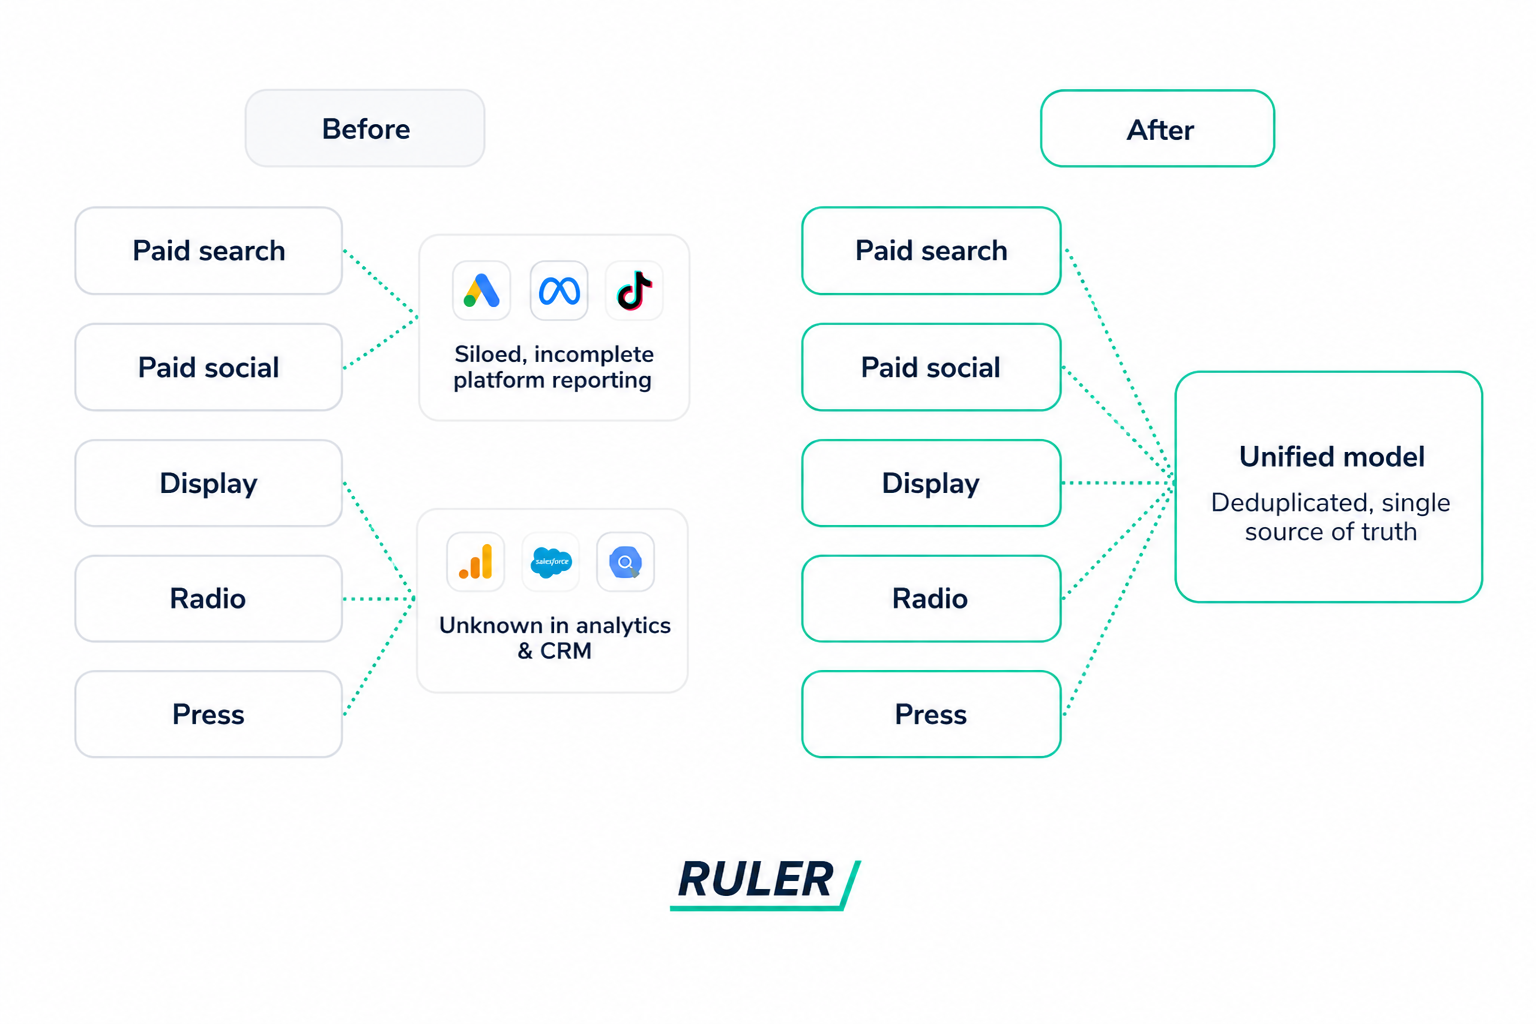
For businesses running significant paid media investment across both digital and offline channels, the measurement problem is familiar.
Analytics tools, ad platforms, and CRM systems each report performance through their own lens, and none of them agree.
Platform dashboards claim overlapping credit, and online and offline performance metrics sit in entirely separate reporting lanes.
The result is a picture that’s not so much inaccurate as it is incomplete; enough data to ‘feel’ informed, but not enough clarity to act with genuine confidence.
This was precisely the situation for one of our clients when they came to Ruler. Their marketing mix spanned both online and offline channels, with budget spread across paid search, paid social, display, radio, and press.
Multiple activation platforms were running simultaneously, with a CRM capturing revenue downstream and several analytics and reporting tools all producing different versions of the truth.
Without a single, unified view that treated online and offline with the same methodology, the team found itself making cautious decisions, not because they lacked capability or ambition, but because nobody could say with confidence where the real performance was coming from.
Building a first-party data platform that unifies online & offline attribution
The starting point was building a marketing mix model, using approximately two years of spend and revenue data, around 100 weeks of weekly inputs across every active channel.
The approach treated online and offline channels identically:
- Looking at weekly spend
- How frequently each channel was live
- How revenue moved in response.
As investment shifted from week to week, the model identified the correlations between marketing activity and business outcomes.
One important methodological decision shaped the whole approach. Rather than anchoring revenue to the date it was recorded, we used the date of first customer interaction.
This is how marketing measurement worked before digital tracking existed, statistically grounded and channel-agnostic.
Applied here but with considerably more granularity than a traditional agency approach would typically offer, and extended to include offline channels that digital attribution tools often ignore entirely.
For any business with a meaningful lead cycle between initial enquiry and confirmed revenue, this distinction matters considerably, it keeps the attribution as close as possible to the actual marketing event, rather than letting reporting lags distort the picture.
What the unified model found
Across all active channels, the initial results were encouraging. Every channel returned a positive ROAS, and most showed headroom for further investment.
However, the more interesting finding was what the model revealed when you placed all channels side-by-side on the same methodology for the first time.
1. Radio outperformed its budget share: Radio came in with a higher ROAS than two digital channels that were receiving significantly more investment. That comparison simply isn’t visible when each platform is reporting in isolation.
2. Paid search was performing but was over-weighted: Paid search was receiving roughly double the budget of radio, but returning a lower ROAS. A reallocation case that only becomes visible when both sit in the same model.
3. Instagram showed promising results, but warrants a cautious approach: Instagram showed an unusually high ROAS, but off a very small spend base. Where the model sees limited signals, it can over-report. Likely more opportunity there, but worth testing incrementally before drawing firm conclusions.
Upper-funnel channels are also harder to measure in MTA, which often leads to under-investment. This makes it even more important to test spend thresholds properly before scaling.
The comparison across channels is only meaningful because every channel is measured the same way. Platform reporting can’t offer that, each platform will always tell you its own story.
The value of a unified model is precisely that it removes the platform as narrator.
Marginal ROAS and scenario planning: Where measurement becomes action
Standard ROAS tells you how a channel performed over the period measured. That’s useful, but it’s a rear-view mirror.
Marginal ROAS asks a different question: given where you are right now, what would your next pound invested in that channel actually return?
It’s a measure of saturation, and it’s far more useful for forward planning than the headline number.
All channels in this model showed some degree of diminishing returns, which is expected, and not a cause for concern in itself.
As you scale reach, you’re progressively targeting less relevant audiences. The important question isn’t whether diminishing returns exist; it’s where you sit on the curve, and whether there’s still meaningful headroom before growth flattens out.
For this business, headroom existed across the board.
That said, ROAS alone doesn’t tell the full story. The image below shows channel-level ROAS across the measured period, a useful baseline, but only the starting point for budget decisions.
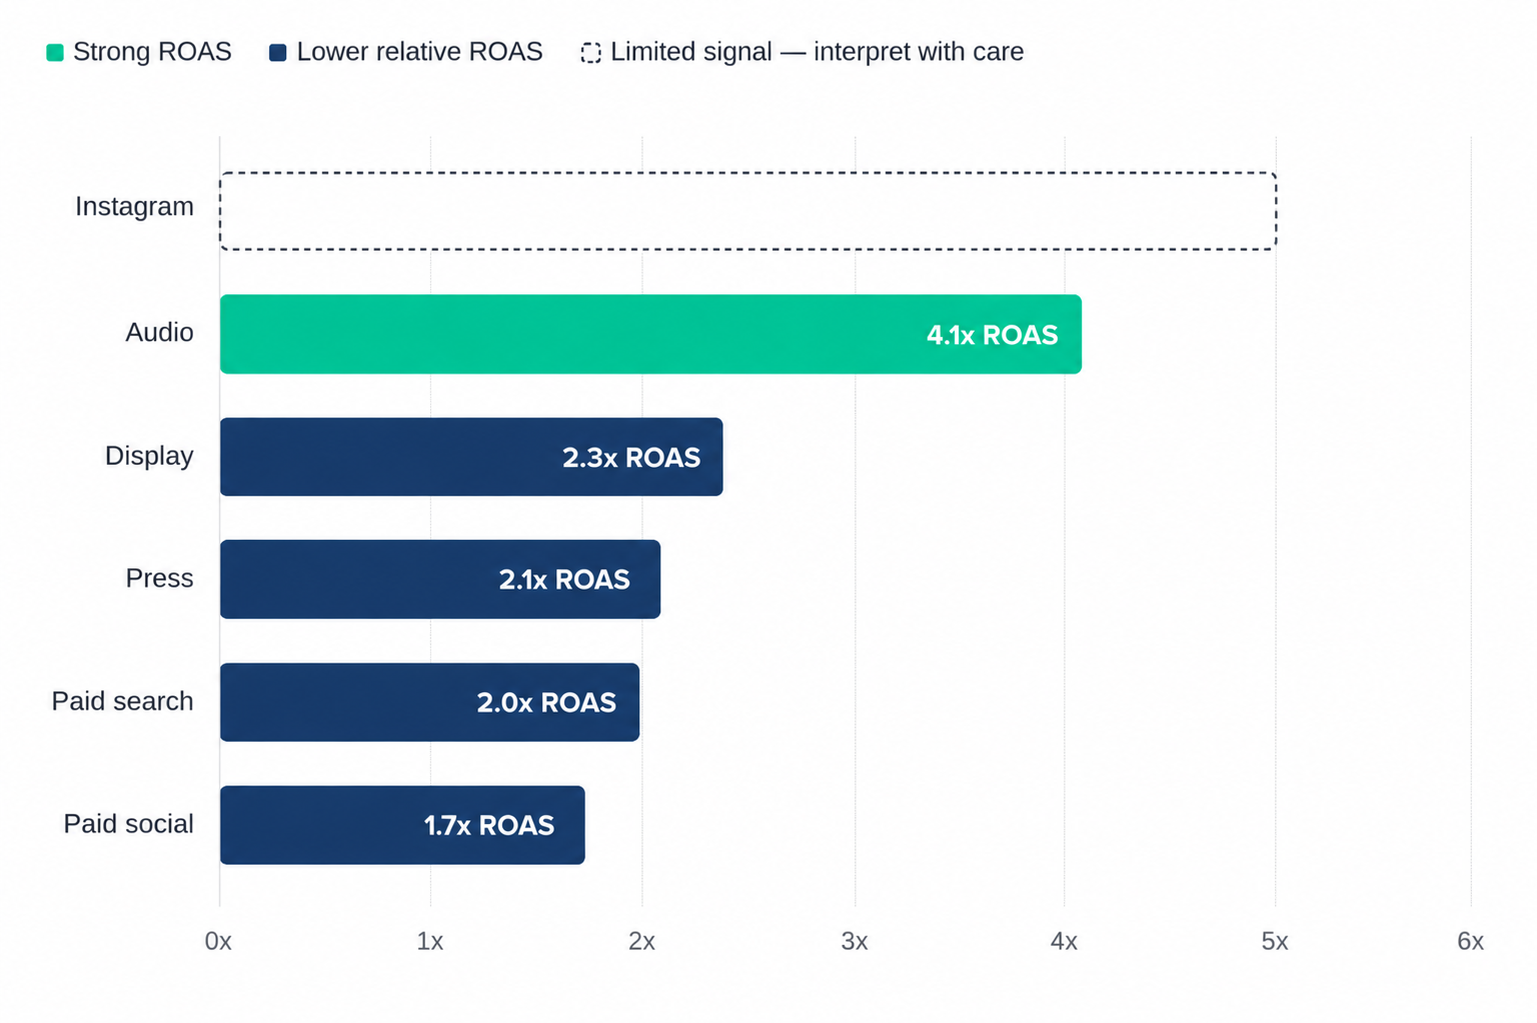
Radio is the standout, with a return meaningfully ahead of every other channel.
Display, Press, and Paid Search sit in a similar band, while Paid Social trails slightly. Instagram carries limited signal and should be interpreted with caution rather than excluded outright.
Where ROAS shows past performance, marginal ROAS reveals what’s actually happening at the margin, and that’s where the allocation decisions get interesting.
A channel can show a strong average return while already being close to saturation, meaning the next pound in will work considerably harder for less.
It comes down to following marginal returns, scaling up where they justify investment and scaling down where they don’t.
The scenario budget planner tool helps by modelling budget shifts across channels.
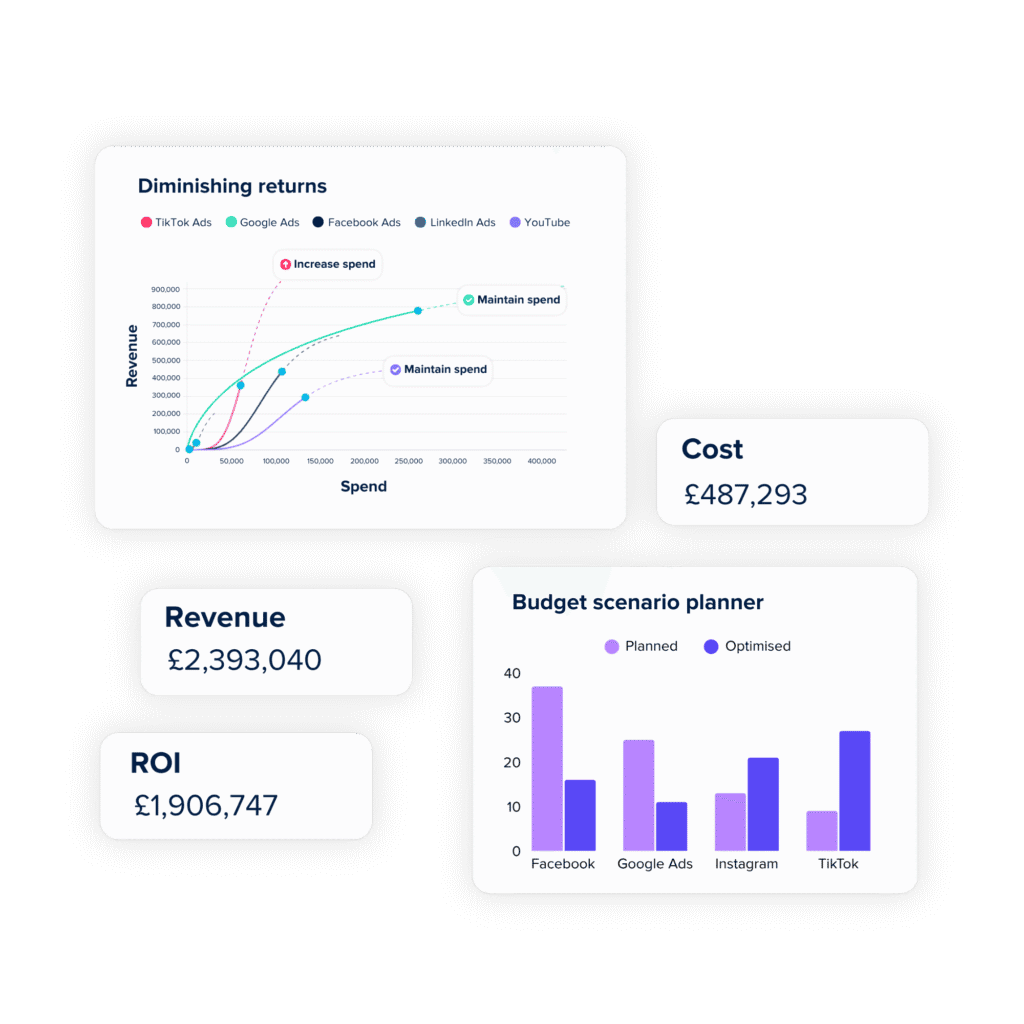
It shows expected outcomes before any decision is made, creating a more disciplined and evidence-based approach than platform benchmarks or intuition.
A clear direction and the confidence to act on it
Coming out of the first model run, the picture was clear.
Strong performance across channels, a budget allocation that didn’t fully reflect where the genuine ROAS opportunity sat, and a solid foundation to build on as more data comes in.
That’s typically how it goes. The first run tells you where to look, and the subsequent runs tell you whether the decisions you made in response were right.
- Online and offline media measured in a single, unified model for the first time, no more separate reporting lanes
- Deduplicated ROAS across all channels, removing the over-counting that individual platform dashboards create
- Clear evidence that radio is under-invested relative to its ROAS contribution, a finding that platform reporting alone would never surface
- Scenario planning capability in place to model budget shifts before committing, replacing gut feel with statistical grounding
- A data model that improves with each run, building towards increasingly reliable forward planning
- Alignment across internal teams and external agencies on a single source of performance truth, supported by a continuously improving model
Ready to see what unified measurement reveals about your marketing mix?
If you’re making budget decisions based on platform reports alone, you’re working with an incomplete picture. Ruler brings your online and offline channels into a single model so you can allocate with confidence, not guesswork.
Book a demo and we’ll show you what this looks like for your specific channel mix.