Login
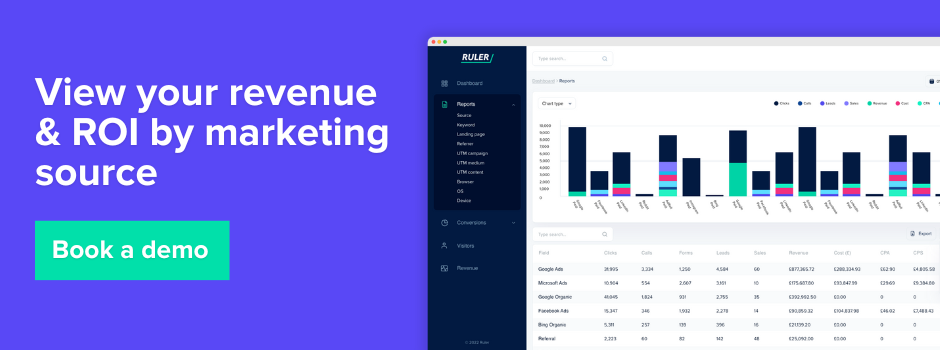
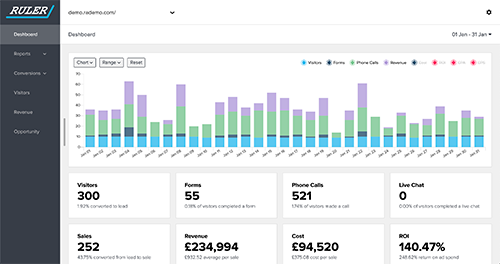
Book a Demo

We cover why ad platforms and GA4 report different results and what to do about it.
Most marketers see different conversion figures in Google Analytics and their ad platforms. It’s not a minor issue, it creates confusion about what’s actually driving results.
This makes it harder to prove ROI, justify spending, or plan what to do next.
You might spot inflated conversions in Meta or Google Ads, while GA shows fewer. Or the same sale gets counted twice.
Either way, it diminishes trust in the data. And when you can’t trust the data, decisions stall.
There are several reasons why your ad platforms and Google Analytics report different numbers.
These differences aren’t always errors, they often come down to how each tool collects, defines, and attributes data.
To make sense of it, it helps to break the causes into clear categories: tracking methods, attribution models, and reporting timeframes. Each plays a part in the gaps you’re seeing.
Many marketers rely on the data inside their ad platforms. It’s easy to access, built into reporting dashboards, and seems detailed enough.
But there’s a major limitation. Each platform only tracks its own touchpoints. Facebook reports on Facebook. Google reports on Google.
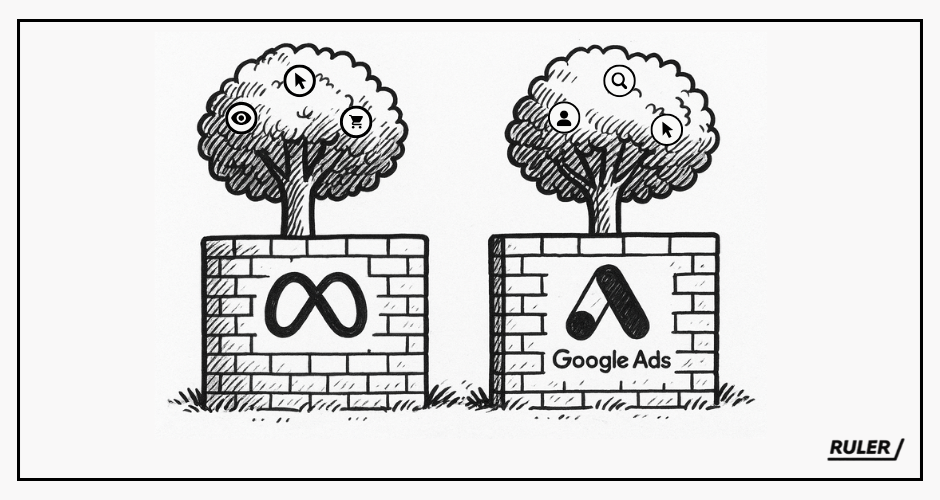
Neither can see what happens elsewhere. This creates a narrow view known as platform attribution myopia.
Every platform works in isolation, giving itself more credit than it deserves.
The same conversion might be counted multiple times, once by Facebook, once by Google, and again by your email tool.
If Facebook shows 250 conversions and Google shows 280, you might think you’ve had 530. But your actual results could be closer to 300.
The rest is duplication. Google Analytics won’t fix this either, which we’ll cover next.
Each platform uses its own attribution rules, which adds another layer of confusion.
Meta defaults to a 1 or 7-day click window and a 1-day view window. Google Ads allows 1 to 90-day windows. TikTok offers 1, 7, 14, or 28-day click windows, with optional view-through attribution.
These settings affect how conversions are counted and when credit is given.
To complicate things further, platforms often use different methods to calculate similarly named metrics. What counts as a “conversion” in one tool may not match another.
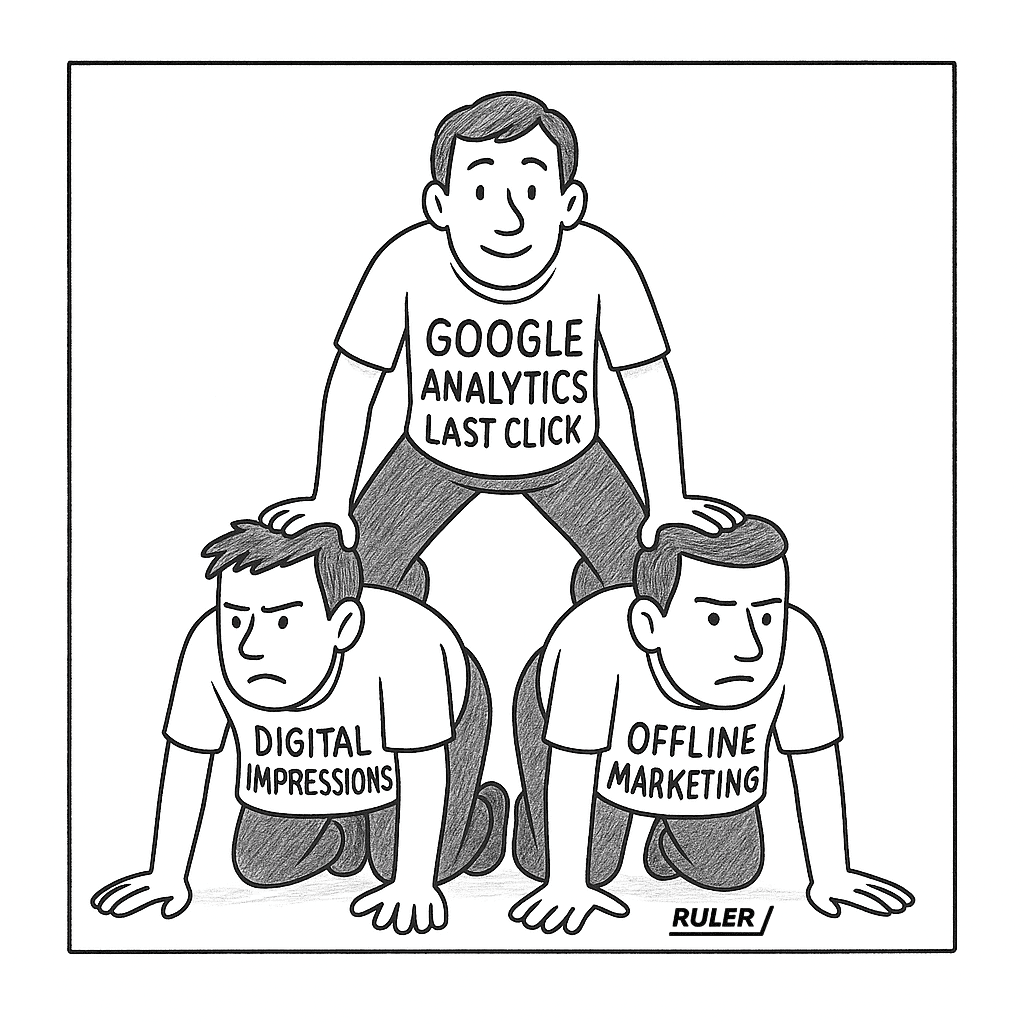
Many marketers turn to Google Analytics for a more independent view. But GA4 has its own limitations.
It only offers two attribution models: last click and data-driven. The latter provides little transparency, and neither fully accounts for long sales cycles. The 90-day window often falls short in B2B or high-value ecommerce.
Instead of resolving conflicts between platforms, GA often introduces a new set of gaps, just in a more neutral-looking format.
Google Analytics 4 doesn’t track impression-based activity or key offline events.
Related: The future of measurement—the role of impression modelling
It’s a deterministic tool, meaning it only records what it can tie to a direct action, typically a click. If someone sees an ad but doesn’t engage, there’s no data point to track.
But impressions matter, especially in the early stages of the journey.
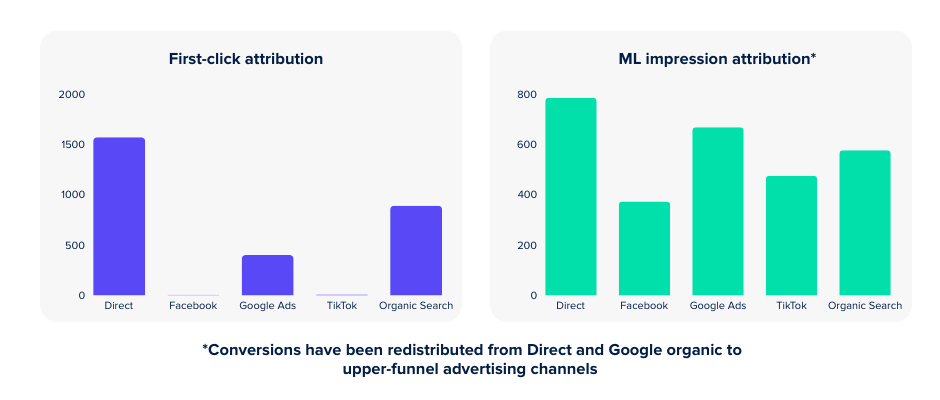
At the top of the funnel, people often see ads without clicking. Research suggests that for every click, there are between 10 and 50 unseen impressions that still shape decisions later on.
This creates a vicious loop. GA4 misses upper-funnel influence, so marketers go back to platform data.
But platform data is duplicated, short-sighted, and self-serving. Without a clear way to measure early-stage impact, teams lose confidence.
Many underinvest in the very campaigns that build awareness and trust, holding back growth in future conversions.
As privacy laws tighten, tracking becomes harder—and less consistent. A major shift began with Apple’s iOS 14.5 update in 2021. It gave users more control over whether apps could track their behaviour across other apps and websites. The result: more than 80% opted out.
Platforms like Meta lost access to the view-through data that helped link ad impressions to later conversions. Without it, there are larger gaps in reporting. Advertisers can no longer see the full picture of what led to a sale, especially when there was no direct click.
Consent also plays a growing role. In many countries, websites must ask for permission before tracking users.
If someone declines analytical cookies, Google Analytics won’t collect their session. But platforms like Google Ads may still record the interaction if ad cookies are accepted. That creates another layer of mismatch.
These privacy changes don’t just affect reporting. They also reduce the volume of data platforms can use to optimise ad delivery.
Fewer signals make it harder for algorithms to target the right users. And with Google Chrome planning to phase out third-party cookies, the ability to track user behaviour across sites will continue to shrink.
The result is a less complete and less consistent view of what’s working, with more discrepancies across tools.
No single tool offers the full truth. Ad platforms report only on what happens in their own ecosystem.
Attribution settings differ across each one, and Google Analytics, while often seen as neutral, offers limited models, excludes impression data, and gives you only part of the picture.
Relying on these platforms in isolation leads to blind spots and distorted decisions about where to spend.
To cut through the noise, you need a unified view. That starts with first-party tracking and multi-touch attribution.
Related: Unified marketing measurement framework
By capturing and stitching together data from across your website, CRM, and ad platforms, MTA links touchpoints to real people using identifiers like email or phone numbers.
It tracks everything from UTM parameters to form fills and phone calls. This helps reduce duplication and shows how your channels work together rather than in isolation.
Related: 4 steps to create a first-party data strategy
But first-party MTA has some blindspots. It can’t fully account for what it can’t see, like impressions that didn’t lead to clicks, or offline channels like TV and print.
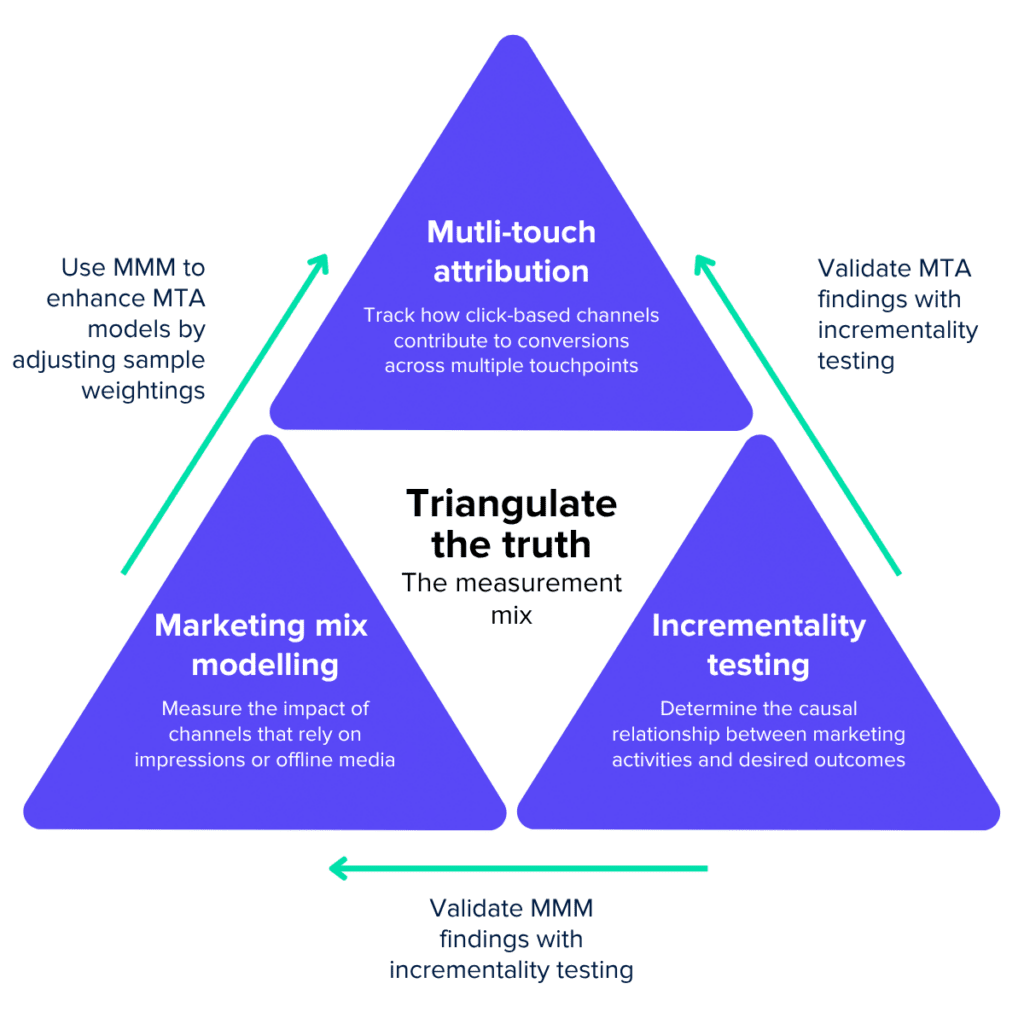
To fill those gaps, marketing mix modelling analyses historical data to estimate how each channel contributes to overall sales.
It accounts for impression-based and offline marketing, such as TV, radio, and print. Also, as it works with aggregated data, it’s well suited for long-term trend analysis and future forecasting.
MMM provides outputs like diminishing return curves that show when extra budget stops driving growth. This kind of evidence helps justify investment and makes planning less reactive.
You can then strengthen this further with incrementality testing. These experiments isolate the true effect of marketing spend, helping you separate causation from correlation.
MMM and MTA become even more powerful when blended together. For example, our Data-Driven Attribution + Impression Model blends the two approaches.
It uses MMM to assign fair weightings to impression-heavy campaigns that traditional attribution overlooks, like paid social or display.
These adjusted weights are then applied to MTA outputs, shifting some credit away from last-click touchpoints like brand search, and towards upper-funnel activity that started the journey.
With this combined approach, each tool plays its part:
Together, they give you a clearer, more confident view of how your marketing really performs.
Measuring marketing success isn’t straightforward. Different platforms, attribution models, and privacy rules create gaps and overlaps in your data.
Without a unified view, it’s hard to know what’s truly driving results and where to invest next.
By combining first-party tracking, multi-touch attribution, incrementality testing, and marketing mix modelling, you can build a clearer, more balanced picture.
This approach reduces duplication, accounts for offline and upper-funnel activity, and delivers insights you can trust.
If you want to see how a unified approach can transform your marketing measurement, book a demo. We’ll show you how to cut through the noise and focus on what really works.