

Few customers make an important purchasing decision in a single session.
They research across several channels, compare options, read reviews, ask for recommendations, engage with a few ads, and then convert in a way that often leaves very little digital trace.
By the time the sale happens, many of the touchpoints that shaped the decision have already dropped out of your attribution model.
That is why the benefits of marketing mix modelling have become so relevant to the teams we speak with every week.
In our own research, 44% of marketers say cross-channel journeys, both online and offline, as a challenge for effective marketing attribution. When budgets are being spread across paid search, social, TV, radio, retail media and more, a measurement approach that only follows clicks is going to miss a good portion of what happened.
Marketing mix modelling uses statistical analysis of your historical spend, activity and revenue to show what each channel contributes to results. It doesn’t depend on cookies, user-level tracking or whether someone happened to click.
In this article we’ll walk through the practical benefits we’ve seen when MMM is put to work, with examples from the businesses we’ve worked with, and we’ll be honest about where it needs support from other methods too.
Here’s a breakdown of the benefits:
- Measures the impact of traditional media
- Measures the impact of impression-led channels
- Accounts of external factors (seasonality, weather, etc)
- Measures the ROI of online and offline channels
- Shows how marketing driving sales on 3rd party sites (Amazon)
- Identifies diminishing returns
- Optimises budget allocation
- Reveals the combined impact of channels
Benefits of using marketing mix modelling
Below are the eight practical benefits we see most often when marketing mix modelling is put to work across a mix of online and offline channels.
It measures the impact of traditional media
TV, radio, print and out-of-home have always been difficult to connect to revenue, because nobody clicks on a radio ad.
Platform reports can’t see them, and last-click models give them nothing. MMM looks at the relationship between weekly spend, the frequency of activity and the revenue that follows, and it applies exactly the same method to offline channels as it does to digital ones.
We saw this with a B2C lead generation business running paid search, paid social, display, radio and press.
Once every channel sat in one model, radio returned a higher ROAS than two digital channels that were receiving significantly more investment.
Across the offline channels that mattered most to that business, the model showed a 9x return. That comparison simply isn’t visible when each platform reports in isolation.
In a separate project with a health consumer brand, TV (combining paid and direct response activity) accounted for 8% of total modelled revenue.
In standard platform reporting that contribution would have been completely invisible, and it gave the team something concrete to put in front of the budget meeting.
It measures the impact of hard-to-track marketing
Not every hard-to-track channel is offline. Connected TV, display, online video, podcasts and paid social often work the way traditional media does.
People see the ad, remember it, and then come back days or weeks later through search, direct or a marketplace. There’s no click, so no recognition in the data.
Half of the marketers we surveyed (50%) report that a lack of tools and applications limits effective marketing attribution, and this is one of the areas where the gap shows up most.
MMM captures lagged effects through adstock analysis, which shows not only what converted but how long an ad’s influence actually lasts.
For the health brand’s direct response TV activity, the model found that 85% of the impact carried forward beyond the week the ad aired. That is a channel doing far more work than any click-based model would ever show.
This is also why we feed MMM-derived impression weightings into our data-driven attribution model. It helps shift away value from over-attributed channels like direct and brand search, and towards the upper-funnel activity that influenced the decision but never earned a click.
It accounts for external influences
Sales don’t move only because of your marketing. Seasonality, competitor activity, economic conditions, pricing changes and even the weather can all push revenue up or down, and without accounting for them it’s easy to give a campaign praise or blame it hasn’t earned.
A good model separates your marketing’s contribution from these outside factors.
Ruler’s MMM, for example, looks at more than 30 variables simultaneously, including seasonality, competitor activity, economic conditions and diminishing returns.
That means a strong December isn’t automatically read as a strong campaign, and a quiet summer isn’t automatically read as a failing one.
No individual ad platform can offer this, because each one only sees its own corner of the picture.
The result is a cleaner baseline. You know what revenue would likely have happened anyway, and you know what your marketing added on top of it.
It measures the ROI of every online and offline channel
Ad platforms each report conversions inside their own attribution windows, and none of them account for what the others are claiming.
Add the reported conversions together and the total will often exceed your actual sales or leads. The platforms are simply measuring from their own perspective.
MMM gives you one methodology across the whole mix, so every channel is compared like for like.
In the lead generation example, every channel returned a positive ROAS and most showed headroom for further investment, and because the model deduplicated revenue, the over-counting that individual dashboards create was removed.
That business took enquiries through online forms and inbound calls, with revenue confirmed offline, and the model still tied it all back to marketing activity.
We anchored revenue to the date of first customer interaction rather than the date it was recorded, which kept attribution close to the real marketing event and stopped reporting lags from distorting the picture.
This matters because only 48% of marketers say they’re fairly confident in their ability to prove ROI. A single, unified view is one of the most direct ways we know of to close that confidence gap.
It shows how marketing drives sales on Amazon and other marketplaces
Marketplace sales have a habit of sitting in their own data silo. Someone sees a TV ad or a social post, searches for the product on Amazon six weeks later and buys it there.
Your website never sees that customer, so your digital reporting never connects the sale to the advertising that prompted it.
Because MMM works from spend and revenue rather than individual tracking, it can include marketplace and retail media sales in the same framework.
For the health consumer brand, which sold across Amazon, Walmart, Costco and QVC alongside its own ecommerce site, this gave the team a clearer picture of how each channel contributed to overall performance.
Amazon contributed 11% of total modelled revenue, and for the first time the team could see how brand and performance activity was flowing through to retail revenue and not only to their own site.
That is a different kind of insight from anything a marketplace’s own reporting can provide, since it links your advertising across every channel to the sales that result on the marketplace.
It identifies diminishing returns
Every channel eventually reaches a point where each additional pound or dollar buys less than the last.
As you scale reach you’re progressively targeting less relevant audiences, so this is expected and it isn’t a cause for concern in itself. The useful question is where on the curve each channel currently sits.
MMM models a diminishing returns curve for every channel. Standard ROAS tells you how a channel performed over the period measured, which is useful but is really a rear-view mirror. Marginal ROAS asks what your next pound invested would actually return, so it works as a measure of saturation and is far more helpful for forward planning.
In the lead generation project, all channels showed some degree of diminishing returns, yet headroom existed across the board.
For the health brand, non-brand paid search had the strongest ROAS on both a reported and a marginal basis, which showed there was room to invest more without hitting saturation quickly.
It optimises marketing budget allocation
Once you know where each channel sits on its curve, budget decisions get far easier to defend.
You can move spend away from channels close to saturation and towards those with room to grow, using evidence rather than habit or the loudest voice in the meeting. This is what effective marketing budget optimisation looks like.
In the lead generation example, paid search was receiving roughly double the budget of radio but returning a lower ROAS.
That reallocation case only became visible once both channels were measured in the same model.
We also saw a good example of caution, because Instagram showed an unusually high ROAS off a very small spend base, and where a model sees limited signal it can over-report.
The sensible move there was to test incrementally before drawing firm conclusions.
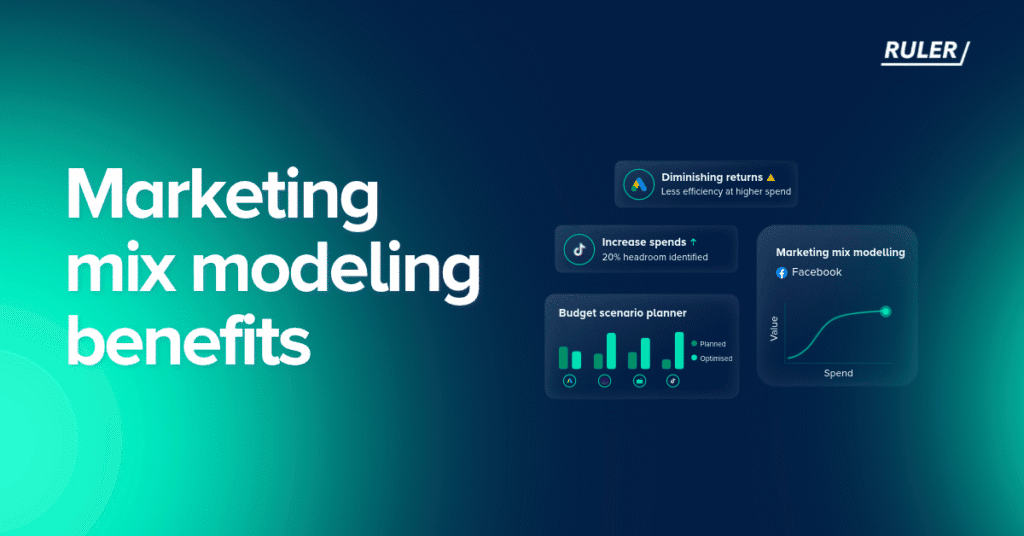
Our own budget scenario planner lets you model efficiency, growth or custom budget scenarios before committing any spend.
You see the expected outcomes first, so decisions rest on predicted business results and not assumptions.
It reveals the combined impact of channels
Marketing channels often work together, with one activity building awareness and another bringing people back to convert days or even weeks later.
For example a…
…TV campaign could lead to a branded search.
…paid social ad could prompt a visit that converts through email a fortnight later.
…display campaign could build familiarity that makes a search ad more likely to be clicked.
Looking at each channel on its own tends to understate the ones that start the journey and overstate the ones that finish it.
MMM measures the effect of all channels together, so these halo effects show up in the numbers.
For the health brand, combining online and offline data gave a clearer view of how digital and brand activity was flowing through to retail sales.
That joined-up picture is what helped the team decide where to push and where to pull back, and it explains why the baseline of that project (53% of the $103M+ in modelled revenue attributed to paid media) was such a useful starting point.
Marketing mix modelling is not the complete answer
We’d be doing you a disservice if we said MMM alone could solve measurement.
It works at an aggregate level, so it tells you how channels perform as a whole but not which individual campaign, keyword or ad contributed to a particular sale. It also needs a reasonable amount of historical data, and it’s better at informing planning than at making daily optimisation calls.
That is why we use it alongside multi-touch attribution (MTA) and testing.
MTA, built on first-party tracking of calls, form submissions, live chat enquiries and other conversions, gives you granular, journey-level reporting down to campaign, ad group, ad and keyword.
Incrementality testing then provides a controlled check on what the model suggests.
In the health brand project, incrementality tests were run through Microsoft Ads holdout audiences as a next step to build the evidence base for ongoing decisions.
The approaches are complementary. MMM shows the big picture and where to look, MTA shows the detail within digital, and testing confirms whether your decisions were right.
Ready to get started with marketing mix modelling?
The gap between what measurement tools report and what is actually happening in the business is manageable when your channel mix is small and simple.
It becomes a real problem when you’re running TV, paid search, retail media and ecommerce at the same time and every budget decision touches all of them.
MMM doesn’t replace your other tools, instead it sits alongside them and gives you a layer of truth that neither platform reporting nor last-click attribution can provide on their own.
Used with first-party tracking, impression modelling and budget scenario planning, it lets you measure every channel on the same basis and plan spend before you commit. If you’d like to see how this could work for your own channel mix, we’d be glad to talk it through. Just book a demo to get started.
Marketing mix modeling benefits FAQ
MMM measures the impact of traditional and hard-to-track media, accounts for external factors like seasonality and competitor activity, and shows the ROI of every online and offline channel on one methodology. It also identifies diminishing returns, supports budget allocation decisions and reveals how channels work together.