Most agencies are working across more platforms than ever. Google Ads, Meta, LinkedIn, organic search, email, CRM, the average client campaign touches six or seven data sources before anyone’s even thought about how to present it.
Pulling that into something coherent, consistent, and actually useful for a client conversation is where a lot of reporting time quietly disappears.
It’s not that reporting is hard, exactly. It’s that it takes time nobody really has, and the manual version of it, logging into all platforms, exporting data, reformatting everything in a deck that looks halfway presentable, has a way of eating entire afternoons that could’ve gone somewhere more useful.
We compiled this list of agency client reporting tools from conversations with agency teams of different sizes, direct feedback, and a thorough read-through of reviews, community threads, and real implementation stories.
What kept surfacing were the same questions, the same friction points, and, encouragingly, the same tools earning genuine praise in similar contexts.
Let’s get into it.
- What are agency client reporting tools?
- What to look for in agency client reporting tools
- Agency client reporting tools reviewed
Key Takeaways
Client expectations around reporting have shifted, visibility and clarity are now part of the service, not an afterthought.
Purpose-built agency tools get you live faster but tend to have flexibility ceilings as your needs grow.
More powerful BI and analytics platforms offer greater depth but require technical resource to get real value from them.
Automated report scheduling is one of the most underrated features to check before committing to any tool.
Attribution tools solve the fundamental challenge of connecting marketing activity to actual outcomes, cutting through the noise to show what’s genuinely driving results, what isn’t earning its place, and where budget should go next.
What are agency client reporting tools?
Simply put, they’re platforms that help agencies pull performance data from multiple marketing channels, organise it, and present it to clients in a format that’s clear, consistent, and doesn’t require a statistics degree to interpret.
That sounds straightforward. In practice, it covers quite a range. Some tools are purpose-built for agencies, white-labelled dashboards, automated report scheduling, multi-client management built into the core product.
Others are broader analytics or BI platforms that agencies have adapted to serve a reporting function, often with more flexibility but also considerably more setup work involved.
A few sit somewhere in between, solid data connectors with decent visualisation, not specifically designed for agency use but capable enough that plenty of agencies rely on them anyway.
The category has grown considerably in the last few years, partly because client expectations around reporting have shifted.
A PDF attachment sent once a month doesn’t quite cut it anymore for most clients. They want visibility. They want to understand what’s working, and they want it presented in a way that doesn’t require three follow-up questions before the numbers make sense.
What to look for in agency client reporting tools
Based on what agencies have consistently flagged as important, and what they’ve flagged as things they wish they’d checked earlier, here’s what we’d focus on.
- White-labelling and client-facing presentation. If you’re sending reports directly to clients, how those reports look matters. Your agency’s branding, not the tool vendor’s. Some platforms handle this beautifully; others treat it as an afterthought. Worth confirming before you commit.
- Multi-client management. Can you manage separate client workspaces cleanly, with their own data sources, their own dashboards, their own scheduled reports? For agencies with more than a handful of clients, this isn’t optional.
- Connector quality for the platforms you actually use. The headline connector count is largely irrelevant. What matters is whether the specific integrations your clients depend on, Google Ads, Meta, LinkedIn, HubSpot, whatever the mix is, are well-maintained, reliable, and refresh at a frequency that suits your reporting cadence.
- Pricing structure at scale. Several tools in this category price per client, per data source, or per user, and the costs compound in ways that aren’t always obvious from the initial pricing page. Running the numbers against your actual client roster before signing anything is worth the twenty minutes it takes.
Agency client reporting tools reviewed
Below is our curated selection of agency client reporting tools, drawn from our experience, direct feedback from agency teams, and insights from online reviews and community forums.
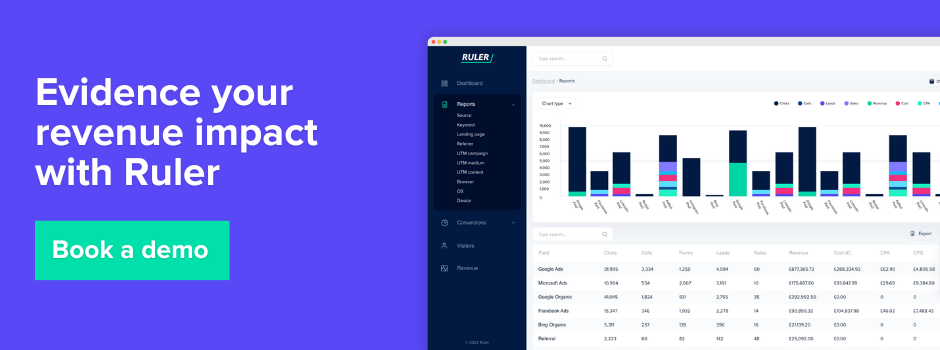
Ruler Analytics – The measurement layer most reporting tools miss
Before getting into the pure reporting tools, it’s worth talking about Ruler separately, because it solves a different problem, and understanding that distinction matters.
Most reporting tools show you what happened. Ruler tells you why, specifically in relation to revenue.
What we’ve designed it to solve
The reporting gap that Ruler addresses is measurement. Your agency might be producing beautiful dashboards showing impressions, clicks, and conversions, but if those conversions are leads rather than direct purchases, the chain from marketing activity to actual revenue is usually broken somewhere. Ruler closes that gap.
It tracks individual visitors across multiple sessions and touchpoints, stitches together the full journey, and when a lead converts into a customer in the CRM, it maps that revenue back to the original marketing source. That data then flows back into Google Analytics, your ad platforms, and wherever else you need it.
For agencies, this means you can show clients not just that a campaign generated leads, but that those leads turned into £X in pipeline or closed revenue. That’s a meaningfully different conversation than click-through rates and cost-per-lead.
Where we see it work best
Lead generation agencies, particularly those working with B2B clients or service businesses where the sales cycle extends beyond the initial form fill. If your client’s sales team is closing deals months after the first marketing touchpoint, and offline, Ruler is built for exactly that scenario.
Consider Ruler if:
- Your clients are lead-gen focused rather than pure eCommerce
- You want to show clients revenue impact, not just service-level metrics
- You’re managing multi-channel campaigns and need to attribute pipeline accurately across touchpoints
- You’ve had the uncomfortable conversation where a client questions the value of a channel that looks underperforming on last-click but is actually contributing significantly to pipeline
Pricing
Starts at around £199/month, scaling with call tracking volume and the number of domains. It’s a considered investment, but for agencies where demonstrating revenue impact is central to client retention, the conversation around its value tends to be fairly short.
AgencyAnalytics
Where it shines
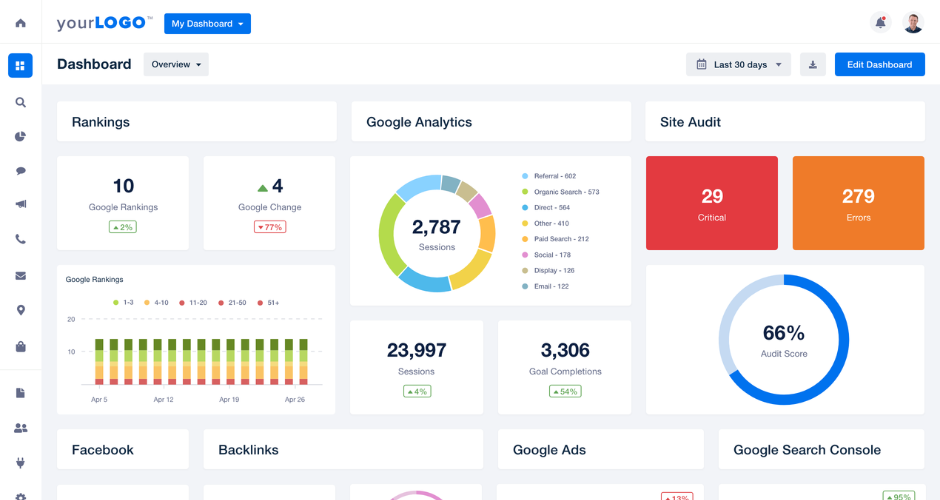
AgencyAnalytics is, fairly straightforwardly, built for agencies. That focus shows throughout the product. The multi-client dashboard structure is clean, the white-labelling options are among the better ones in this category, and the automated reporting, scheduled reports that go directly to clients without anyone manually triggering them, works reliably.
The connector library covers the platforms most agencies deal with day-to-day: Google Ads, Meta, LinkedIn, Google Analytics, Semrush, Ahrefs, and a reasonable spread of others. Setup is genuinely accessible; account managers without a technical background can typically get a client dashboard live within an hour or so.
The SEO reporting features are a particular strength. For agencies with a strong organic search offering, having rank tracking, backlink data, and site audit metrics alongside paid and social data in one place is genuinely useful rather than just convenient.
Where it falls short
The data transformation capabilities are limited. You’re largely presenting data as it arrives from the source, and if you need to blend datasets, apply custom calculations, or build anything more complex than a standard performance dashboard, you’ll hit the ceiling fairly quickly.
Deeper customisation of report layouts can also feel a bit constrained compared to more flexible tools. For agencies where every client wants something slightly bespoke, that can become a slow frustration over time.
Consider AgencyAnalytics if:
- You’re a small-to-mid-size agency that needs a reliable, purpose-built reporting tool without significant technical overhead
- Automated client reporting and white-labelling are priorities
- Your reporting needs are relatively standardised across clients
Pricing
Starts around $12 per client per month on the freelancer plan, with agency plans from approximately $18 per client per month. Worth modelling out the total cost against your actual client roster size before committing.
Whatagraph
Where it shines
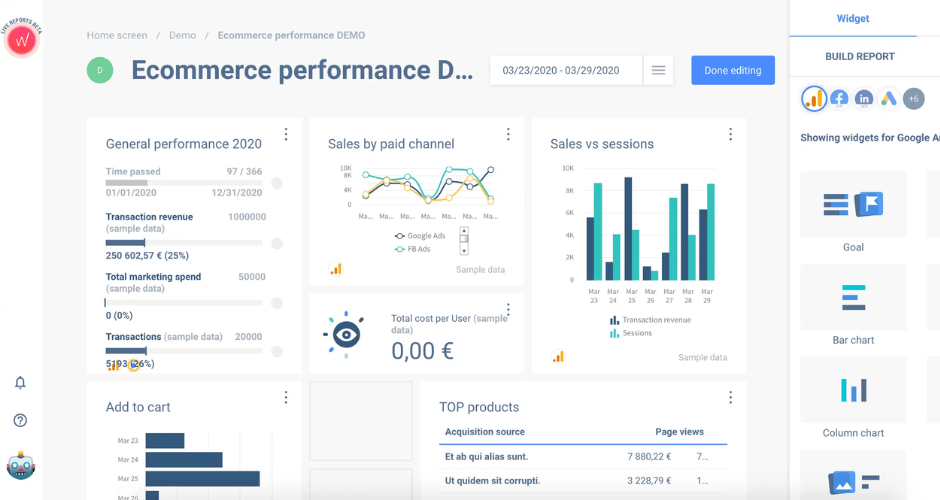
Whatagraph’s strongest suit is presentation. The reports look genuinely good, well-designed, visually coherent, the kind of thing you can send to a client without any hesitation about how it reflects on the agency. The drag-and-drop report builder is intuitive, the templates are thoughtfully put together, and the white-labelling is solid.
Automated scheduling works well, and the multi-source data pulling covers the main marketing platforms agencies typically work with. For agencies where the visual quality of reporting is a meaningful part of how they present value to clients, Whatagraph sits near the top of the list.
Where it falls short
It’s a reporting tool rather than an analytics tool. The data processing is relatively light, you’re connecting sources and visualising what comes through, not transforming or deeply analysing it. For straightforward campaign reporting that’s often perfectly sufficient; for anything requiring custom metrics or complex data blending, it’s limiting.
The pricing is on the higher end relative to what you’re getting purely in terms of data functionality. You’re paying meaningfully for design quality and reporting automation, which is a legitimate trade-off but one worth being clear-eyed about.
Consider Whatagraph if:
- Visual presentation quality genuinely matters to your agency’s client relationships
- You need automated, scheduled reporting across multiple clients with minimal manual effort
- Your reporting needs are marketing performance-focused rather than deeply analytical
Pricing
Agency plans start around $223/month. Not inexpensive, but agencies that have calculated the time saved on manual report production often find the maths works reasonably in their favour.
DashThis
Where it shines
DashThis is another tool built with agencies clearly in mind. It’s straightforward, the interface is clean, and the automated reporting works reliably. White-labelling is available, the connector list covers the essentials, and the preset dashboard templates get you to a presentable client report without much fuss.
For smaller agencies or freelancers managing a reasonable number of clients and needing something that just works without a lot of configuration, DashThis is a sensible choice. It doesn’t try to be more than it is, which is actually a quality worth appreciating in a space where a lot of tools oversell themselves in demos.
Where it falls short
The flexibility ceiling is reached fairly quickly. Customisation options are more limited than tools like Klipfolio or Tableau, and the data blending capabilities are basic. If your clients have complex or unusual reporting requirements, DashThis will likely feel too constrained before long.
The design quality, while clean and professional, is perhaps a step behind Whatagraph for agencies where visual presentation is a key differentiator.
Consider DashThis if:
- You’re a smaller agency or freelancer needing a reliable, no-fuss reporting tool
- Your client reporting needs are fairly standardised
- You want automated scheduling and white-labelling without a steep learning curve
Pricing
Plans are dashboard-based rather than per-client, starting around $49/month for 3 dashboards and scaling to $399/month for 50 dashboards. The pricing structure is refreshingly predictable, which matters for agency budgeting.
Google Analytics (GA4)
Where it shines
I’s free and enormously capable. Almost certainly already installed on every client website you work on. For agencies, Google Analytics is less a choice and more a baseline, it’s the data source that feeds into most other tools on this list rather than a standalone reporting solution in itself.
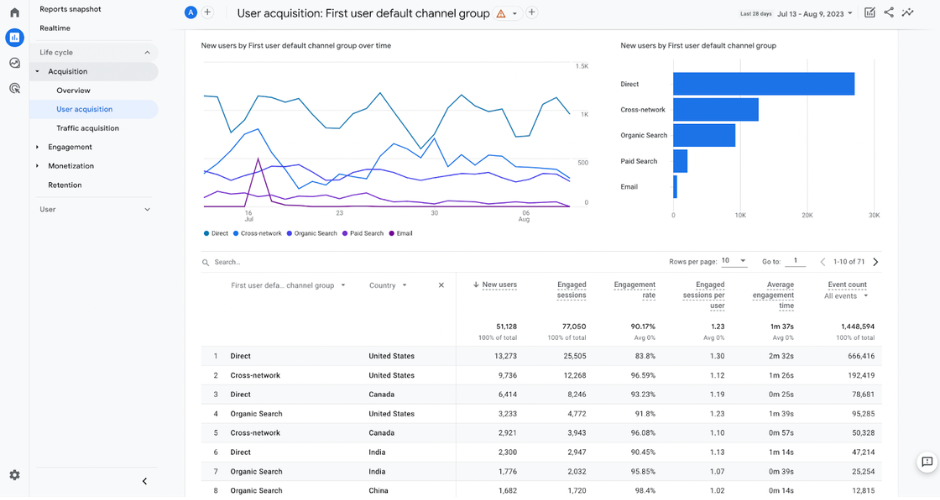
That said, for agencies willing to invest time in building custom reports and explorations within GA4, the depth of data available is substantial. Event tracking, audience analysis, conversion path reporting, and the integration with Google Ads make it genuinely powerful in the right hands.
Where it falls short
GA4 is not, in any meaningful sense, a client reporting tool on its own. The interface isn’t designed for non-analysts, and sending a client a GA4 report link and expecting them to find it intuitive is optimistic at best. It also only covers your clients’ own website and app data, not paid media spend, social performance, or any off-site activity.
The transition from Universal Analytics to GA4 has also been a genuine adjustment for a lot of teams. The data model is fundamentally different, and some reporting that was straightforward in UA requires meaningful rethinking in GA4.
Consider Google Analytics if:
- You need a free, robust source of website and conversion data that feeds into other reporting tools
- You have the analytical capability to build custom reports and explorations
- You’re using it as a data source alongside a dedicated client reporting tool rather than as your primary client-facing deliverable
Pricing: Free for the standard version. GA4 360 (enterprise) is considerably more expensive and typically only relevant for very large clients with substantial data volumes.
Supermetrics
Where it shines
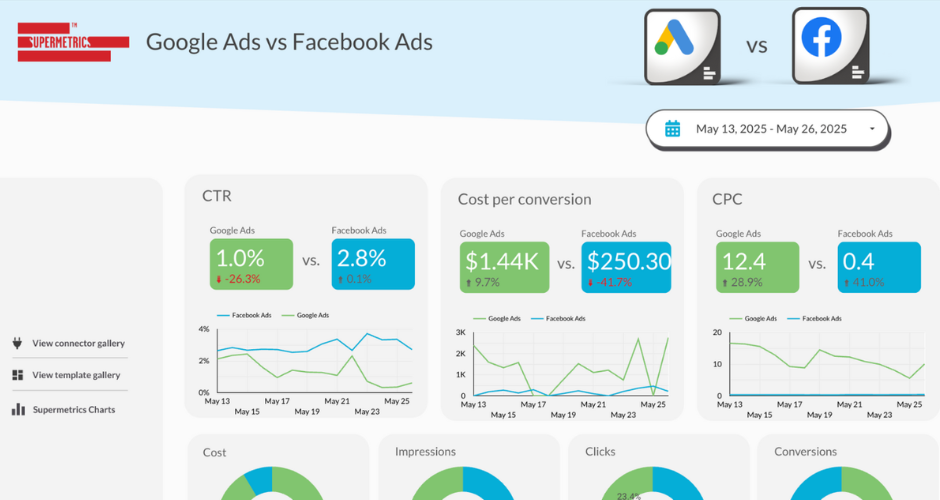
Supermetrics is, for many agency analysts, the tool that first made pulling marketing data into one place feel manageable. The Google Sheets integration in particular is excellent, if your reporting workflow lives in spreadsheets, Supermetrics can pull data from across your ad platforms and analytics tools directly into a sheet on a schedule, cleanly and reliably.
The connector library is broad, covering most of the ad platforms and marketing tools agencies deal with regularly. For analysts who are comfortable in spreadsheets or Looker Studio and want a well-maintained data pipeline feeding those tools, it’s a solid and well-established workhorse.
Where it falls short
It doesn’t store data, it queries fresh each time, which means historical comparisons can get complicated if source platforms change their data structure (which they do, periodically and with minimal warning). Data freshness is limited on most plans, refreshing once or a few times per day rather than anything close to real time.
The pricing model also has a habit of surprising people. Each connector costs separately, and once you’re pulling from five or six sources across multiple clients, the monthly total can climb considerably beyond what the entry-level pricing suggests.
Consider Supermetrics if:
- Your reporting workflow is built around Google Sheets or Looker Studio
- You have analytical capability in-house and prefer to build your own reports rather than use pre-built templates
- You need a reliable data pipeline into your existing tools rather than a standalone reporting platform
Pricing
Starts around $99/month per destination (e.g., Google Sheets), with costs increasing per connector. Modelling out the full cost against your actual connector needs before signing up is strongly recommended.
Klipfolio
Where it shines
Klipfolio sits in an interesting position, more flexible and technically capable than purpose-built agency reporting tools, but more accessible than something like Tableau. The dashboard customisation is genuinely extensive; you can build quite specific visualisations and data views that simply wouldn’t be possible in more constrained tools.
For agencies with analysts or developers who enjoy building things, Klipfolio can produce some impressive results. The data blending capabilities are reasonably strong, and the connector range covers the main marketing platforms alongside a decent spread of business data sources.
Where it falls short
The learning curve is real. Getting the most from Klipfolio requires more technical investment than most tools on this list, and for account managers without an analytical background, it’s not something they’d typically configure independently. If your agency doesn’t have that technical resource available, the flexibility it offers becomes largely theoretical.
The dashboards also require effort to make look genuinely polished. Out of the box, reports don’t have the visual finish of something like Whatagraph without meaningful configuration work.
Consider Klipfolio if:
- You have technical resource in-house who can build and maintain custom dashboards
- You need flexibility that purpose-built agency tools can’t provide
- You’re working with clients who have unusual data sources or specific reporting requirements beyond standard marketing channels
Pricing: Plans start around $99/month, scaling with users and data sources.
Mixpanel
Where it shines
Mixpanel is a product analytics tool rather than a marketing reporting tool, and that distinction matters. Where Google Analytics tracks sessions and page views, Mixpanel tracks user behaviour, what people actually do inside a product, how they move through flows, where they drop off, which features they engage with and which they quietly ignore.
For agencies working with SaaS or app clients where product engagement data is as important as marketing performance data, Mixpanel provides depth that marketing-focused tools simply don’t offer. The funnel analysis and retention reporting are particularly strong.
Where it falls short
It doesn’t cover marketing channel data. There’s no ad spend, no campaign performance, no paid media attribution in Mixpanel. It’s focused entirely on what happens once a user is inside the product. For most agency reporting purposes, it’s therefore one layer of a wider picture rather than a complete solution.
The interface, while powerful, isn’t designed for non-technical stakeholders. Presenting a Mixpanel report to a client who isn’t particularly data-literate requires some careful framing and, often, a fair bit of translation.
Consider Mixpanel if:
- You work with SaaS or app clients where product behaviour data is central to the story you’re telling
- You need funnel and retention analysis beyond what GA4 provides
- You’re comfortable combining it with a separate marketing reporting tool for the full client picture
Pricing
A free tier is available up to 20 million monthly events; paid plans from around $28/month, scaling with event volume.
Tableau
Where it shines
Tableau is in a different league in terms of analytical capability. The visualisation options are extensive, the data blending is powerful, and for agencies working with clients who have genuinely complex data environments, multiple business units, large datasets, unusual sources, Tableau can produce analysis and reporting that simply isn’t possible in lighter tools.
The ability to connect to almost any data source, including databases, spreadsheets, cloud services, and custom APIs, means Tableau rarely hits a ceiling that can’t be worked around. For the right use case, it’s a formidable piece of kit.
Where it falls short
The implementation cost, in time, skill, and money, is significant. Building good Tableau dashboards requires proper training or dedicated resource, and maintaining them as data sources evolve requires ongoing attention. For smaller agencies or those without data-specialised staff, it’s genuinely difficult to justify.
It’s also not purpose-built for agency client reporting in the way that AgencyAnalytics or Whatagraph are. There’s no automated client report scheduling, no native white-labelling designed around agency workflows, no multi-client management out of the box. You can build those workflows, but it takes meaningful effort and someone who knows what they’re doing.
Consider Tableau if:
- You have enterprise clients with complex data environments that lighter tools can’t adequately serve
- You have dedicated data analysts or BI resource in-house
- You’re looking for a long-term analytical capability investment rather than a quick reporting solution
Pricing
Starts around $75 per user per month for Tableau Creator. Enterprise pricing is custom and considerably higher. Not a casual purchase by any measure.
A few final thoughts on agency reporting software
Choosing a reporting tool is, in practice, a decision about where your agency’s time goes. The right tool for a ten-person agency focused on paid social is almost certainly different from the right tool for a thirty-person full-service agency with enterprise clients and a dedicated data team.
What the agencies who seem happiest with their setups tend to have in common: they were honest about their team’s actual technical appetite before choosing, they modelled out the real cost across their full client roster, and they picked something that does one or two things well rather than chasing a tool that promised to do everything.
Perhaps the most useful question isn’t “which tool is best” but “which tool fits the way our team actually works.” The answer to that one tends to make the rest of the decision fairly clear.