2020 was a tough year for those working in automotive. While automotive digital ad spend declined in 2020 due to Covid-19, getting cut-through now is more important than ever. Using data from our global database of over 100 million data points, we share the latest automotive marketing statistics you need to know.
The majority of shoppers for automotive start their journey online. They find and compare dealerships using online search and reviews. They will likely already have a car model in mind, as well as a budget, so their searches will be highly targeted. Once their research is completed, their customer journey will go offline.
They might call a dealership or visit in person to view the cars face-to-face.
Key Marketing Statistics for the Automotive Sector
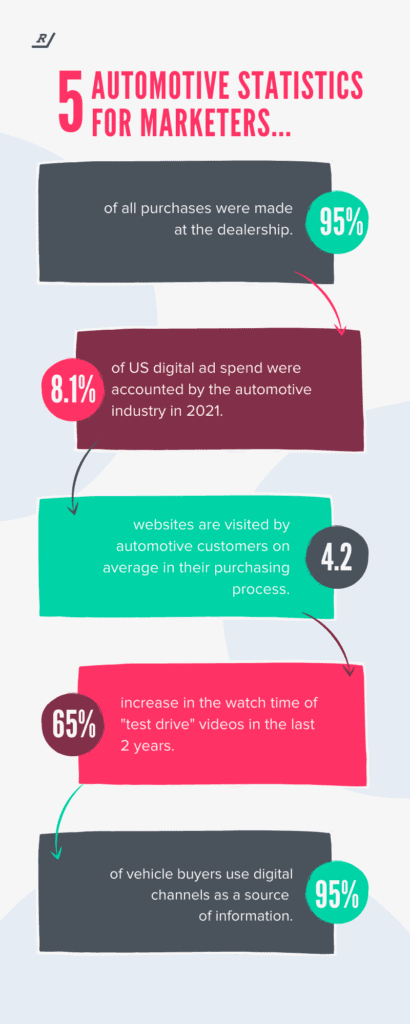
1. Hyundai conducted research into where sales happen in the automotive industry. They found that 95% of all purchases made happen at the dealership.
2. In 2021, automotive accounted for 8.1% of all US digital ad spend. We know that paid spend drives around 38% of traffic on average so competition is fierce. As such, the automotive industry will represent a large portion of marketing spend in the US, and likely other divisions too.
3. Automotive consumers visit an average of 4.2 websites in their purchasing process. And, they’ll often use multiple devices throughout this process.
4. In the last two years, the watch time of “test drive” videos on YouTube has grown by more than 65%. This highlights the key role of social and long-form content.
5. Auto shoppers use digital to start their customer journey. Think with Google found that 95% of vehicle buyers use digital channels as a source of information. And that, in fact, twice more start their research online as opposed to in the dealership.
Combining this with the knowledge that purchases happen at the dealership leaves automotive marketers with a data-tracking conundrum. While purchasers commonly start their customer journeys online, they convert offline.
We wanted to investigate these statistics. Given we serve thousands of marketers across multiple industries and countries, we collated millions of data points to find conversion rate averages by industry.
Here are some of our major findings for the automotive industry.
Marketers in the automotive industry see average conversion rates of 2%
Even with offline conversion tracking, marketers in automotive had an average conversion rate of 2%. However, there’s plenty of wiggle room in this industry. We found that top performers in the automotive industry can see conversion rates of up to 16%.
That leaves huge scope for automotive marketers to refine their outputs and drive more sales-ready leads.
Paid search drives the most web traffic
Our conversion benchmark report for the automotive industry found that 38% of web visitors came from paid search.
PPC, or pay-per-click is a great channel when you want to get your business in front of a targeted audience. And we know that vehicle purchasers use digital channels to research online.
So, by implementing a highly targeted and efficient keyword strategy, you could easily reach a huge number of potential customers. And remember, with Ruler’s marketing attribution tool, you can learn which keywords are resulting in the most clicks, leads and sales.
Organic search is important for the automotive industry
Hold on, don’t go gunning for paid media. Organic search is still a massively useful channel for the automotive industry.
In fact, our conversion benchmark report found that 28% of searches came from organic search.
While you might find high competition for terms like “car dealership”, there are still plenty of opportunities for you online. Try optimising your Google Business page so you appear in local searches. And create content and landing pages to match more specific keywords like “car dealership Liverpool” or “Ford Focus for sale Liverpool”. By chasing long-term traffic like this, you’re more likely to reach a more qualified audience.
Organic social shows opportunity for conversions
We found that organic social had the highest conversion rate of all the major channels at 2.9%.
Download the full conversion benchmark report for the automotive industry here to learn how other channels support conversions.
Organic social might sound like a surprising one, but remember that local aspect. Facebook is a great tool for businesses to get visibility with a local audience.
And remember, chances are, those scoping out your social pages have already heard of you elsewhere. They’re likely checking out your Facebook reviews and testimonials to check you’re a reputable dealership. And so, you should really maximise your social proofing where you can and watch the sales roll in!
Organic search helps support conversions
What did we just say about social proof? Well, you can find more social proof on organic search. If customers already know about your business, they might want to check Google reviews to check if other customers have had a good experience with your car dealership.
We found that organic search has the second-highest conversion rate by channel at 2.5%.
By optimising yourself for local search and social proof, you can drive more traffic and more sales.
Email comes out bottom for conversions
Our conversion benchmark report for the automotive industry found that email had the lowest conversion rate by channel at 0.8%.
We can’t say we’re that surprised. Chances are, your email list is previous customers. Cars have a long shelf life so you’re unlikely to find repeat customers in this industry. So, while it’s great to have a newsletter just in case there are some potential leads, chances are it won’t have huge success.
What is a good conversion rate for the automotive sector?
Overall, we found that the automotive industry has an average conversion rate of 2.0%. But, within our analysis, some players were seeing a conversion rate of 16%.
Many major players in the automotive industry are seeing lower conversion rates due to lack of offline conversion tracking.
Which channels have the best conversion rate for car dealerships?
Want to know which channels have the best conversion rate in the automotive industry? We’ve listed them all for your ease.
Coming in first is organic social with a conversion rate of 2.9% followed by organic search at 2.5% (that’s across Google, Bing and Yahoo).
Next is direct with a conversion rate of 2%, followed by referral at 1.8% and paid social at 1.7%.
After that is paid search with a conversion rate of 1.3%. Lastly is email marketing with a conversion rate of 0.8%.
But remember, these are industry averages. What might work well for other car dealerships might not work best for you.
Wrapping up
Did you know that if you work in the automotive industry, you could be missing up to 48% of your data? That’s because we found in our conversion benchmark report that 48% of website visitors call car dealerships.
Without call tracking and marketing attribution, you can’t then associate that call with a closed sale.
But that’s where we come in.
Our marketing attribution tool allows you to close the gap between your sales and your marketing.
The difficulty for marketers in the automotive industry is finding more and more customers. Unlike other industries, you can’t upgrade or find repeat customers as consumers aren’t looking to purchase multiple cars per year.
Hopefully, this blog has taught you the importance of social proofing and organic search optimisation.
But remember, the only way to know what’s truly working is by adopting a marketing attribution tool yourself so you can interpret your own data, not somebody else’s.
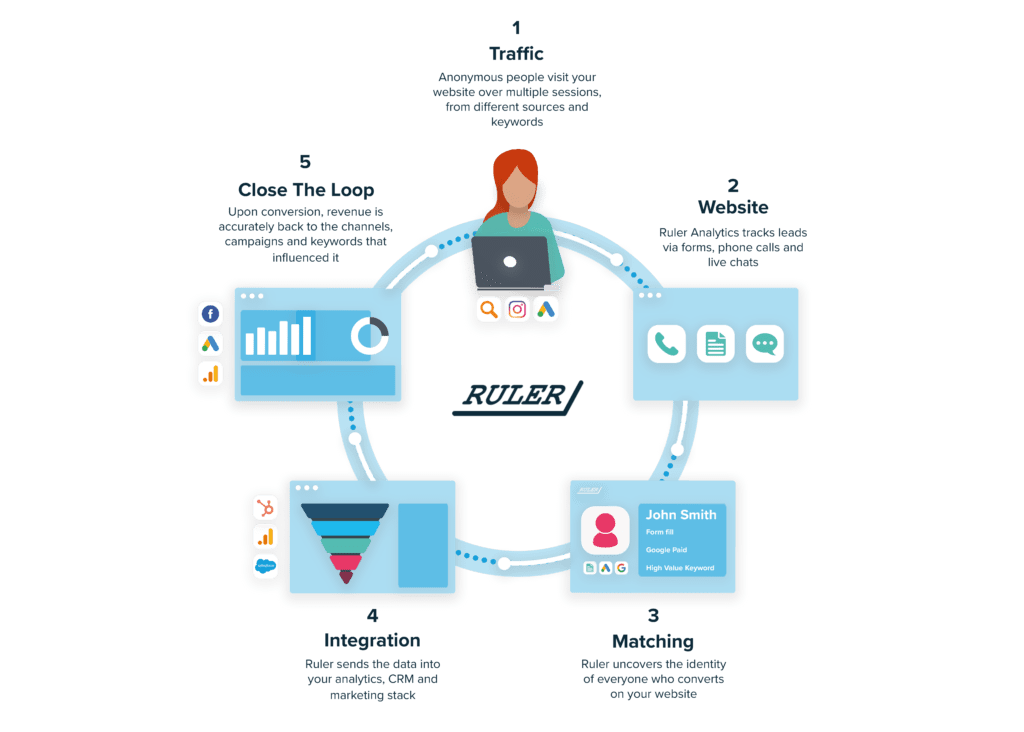
Ruler works like this
Sound good? See Ruler in action by booking a demo with our attribution experts. Or, download our full conversion benchmark report for the automotive industry.