Track your LinkedIn ad campaign performance the right way and gain better insights to drive higher-converting leads at a lower cost.
Measuring your LinkedIn ads is key to giving you the insights you need to grow your business.
If you don’t know how your LinkedIn ads are doing you can’t improve them, which is why measuring your ads is non-negotiable.
Do a quick search on Google, and you’ll find tons of metrics and techniques to track your LinkedIn ad campaigns.
But what is the best and easiest way to accurately determine the success of your LinkedIn ads? Let’s find out together.
In this article, we’ll discuss:
- Why use LinkedIn Ads in marketing?
- What do the metrics mean in LinkedIn Campaign Manager?
- How we measure LinkedIn Ad performance
Pro Tip
Ruler makes the process of measuring ad effectiveness much easier. It tracks data on a visitor level, allowing you to successfully attribute leads and revenue across multiple campaigns, ads, keywords and more.
How Ruler Analytics affects paid advertising strategy
Why use LinkedIn ads in marketing?
If you’re not advertising on LinkedIn, you’re missing out on a ton of potential leads and customers. LinkedIn ads offer numerous benefits for B2B advertisers, which we’ve outlined below.
LinkedIn is the biggest professional social media platform
Let’s start with the facts.
- There are over 830 million users on LinkedIn.
- In every second that goes by, there is one person that logs in on LinkedIn.
- Approximately 50% of its members are considered “decision makers”.
LinkedIn is the biggest professional social media platform. Almost every business professional has a LinkedIn profile, and most of them use it every day to share news, ideas and experiences.
It’s by far the most-used social media platform by B2B professionals. With an audience that big, businesses can benefit greatly from Linkedin to drive huge revenues and success.
Linkedin has an extensive list of targeting options
When it comes to professional targeting selections, nothing beats LinkedIn.
The targeting options on LinkedIn are much more robust compared to other social media platforms.
LinkedIn is a business-oriented platform. So its targeting options revolve around professional criteria including job title, job seniority and company size.
This allows advertisers to run ads directly to a list of specific decision-makers at relevant companies to ensure optimal spending.
LinkedIn has a higher conversion rate
For some businesses, conversion rates on LinkedIn are often higher than other social channels.
The data backs it up. HubSpot found that, on average, LinkedIn ads convert users to leads at a 6.1% conversion rate. That compares to the 2.5% conversion rate average from Google Search Ads.
So, when used correctly, LinkedIn can be extremely effective in generating leads and driving traffic to your website.
What are the most important metrics in LinkedIn Campaign Manager?
LinkedIn Campaign Manager offers a wide selection of metrics to capture the performance of your LinkedIn ads. Let’s hone it down to the most notable metrics in LinkedIn Campaign Manager.
- Impressions
- Average CPM (cost per impression)
- Clicks
- Average CTR (click through click)
- Average CPC (cost per click)
- Conversions
- Cost per conversion
Impressions
First up on our list, we have impressions.
Also referred to as views, impressions is the number of times your ad content has been displayed.
Every time an ad is shown to a user, it’s counted as an impression. That means a single user can have multiple impressions (or views) for the same ad.
Tracking impressions can be helpful as it helps you gain a better understanding of the overall reach and visibility of your ads.
Average CPM (cost per impression)
CPM is a metric that goes hand in hand with impressions.
As the name suggests, CPM (cost per impression) refers to the cost that an advertiser pays per one thousand advertisement impressions.
CPM is most effective when trying to increase brand awareness. So if your goal is to drive more leads, then CPM wouldn’t be the most reliable metric to track your ad effectiveness.
Clicks
Clicks are what you would expect them to be.
It’s the number of times users have chosen to click on your LinkedIn ad.
Tracking clicks can help you understand what ads and messaging work best for your audience.
Clicks often act as the first point of contact between your ad campaign and target audience and show how effective your ads are at getting people to visit your website.
Average CTR (click-through rate)
CTR, or click-through rate, is the number of clicks that your ad receives divided by the number of times your ad is shown.
For example, if your LinkedIn ad had 1,000 impressions and ten clicks, your CTR would be 1%.
Generally, the higher your CTR, the more effective your ad campaign is at bringing people to your website.
If you have a low CTR, that could indicate that you’re targeting the wrong audience or that your ads are not compelling enough to click.
Average CPC (cost per click)
Cost per click is a popular metric used by advertisers. It’s used to indicate the amount each click costs on LinkedIn.
The cost per click formula is simple. It’s your total cost divided by the total number of clicks.
While cost per click is an important part of advertising, it’s only useful if you understand how your clicks translate into leads and new business.
It’s important to remember that not all clicks are created equal. Just because someone clicked an ad on LinkedIn does not mean they’re going to buy.
If you want to understand the true value of your clicks, your best option is to focus on revenue per click.
Revenue per click is the average revenue for each click on all of your ads.
We won’t go into this here, as we have a complete guide on revenue per click that’ll help you better understand how it works.
Conversions
Chances are you know what a conversion is, but let’s assume you’re starting from scratch.
In Campaign Manager, a conversion is an action taken by a LinkedIn user that is considered valuable to your business.
A conversion could be filling out a form, making a purchase or downloading a whitepaper.
Conversion tracking is a must. It lets you see how many people are completing your desired goal and track how well your ads are working to drive meaningful results.
When starting LinkedIn, you can select how each ad interaction is assigned credit for conversions across multiple campaigns.
Linkedin offers two attribution models, these are
- Last-touch (each campaign)
- Last-touch (last campaign)
While last-touch has long been the “go-to” attribution option, it’s not the most reliable. Last-touch doesn’t account for any previous interactions a consumer had with your ad before the final conversion.
This isn’t an issue if your LinkedIn ads are driving traffic at the bottom of the funnel (BOFU), but if you’re running a brand awareness campaign, chances are your ad campaign is getting undervalued.
It’s for this reason that more and more advertisers are investing in multi-touch attribution software.
Don’t take our word for it. The global marketing attribution software market is expected to cross more than $4.5 billion by 2026.
With marketing attribution tools like Ruler Analytics, you can keep a record of your consumers’ touchpoints and understand which content and ads have the greatest influence on your visitor journeys.
Pro Tip
One benefit of Ruler is that it uses marketing mix modelling to determine the impact of different LinkedIn ads on business metrics such as revenue. Ruler’s marketing mix modelling attempts to track invisible touchpoints such as LinkedIn ad views, allowing you to gain a clear picture of your marketing wins (and losses).
Learn more about Ruler’s marketing mix modelling
Cost per conversion
Cost per conversion works the same as cost per click with a slight difference.
Instead of clicks, you take your total cost divided by the total number of conversions.
Like CPC, cost per conversion is a useful metric to understand how your ads are working to drive traffic and leads.
But it’s not the be-all and end-all of marketing measurement.
Related: Cost per lead: Is your marketing effective?
Let’s use an example to explain.
Below is click and conversion data for three separate LinkedIn campaigns.
| Campaign | Cost | Clicks | CPC | Conversions | Cost per conversion |
| Ad campaign 1 | £500 | 50 | £10.00 | 3 | £166.67 |
| Ad campaign 2 | £500 | 100 | £5.00 | 20 | £25.00 |
| Ad campaign 3 | £500 | 20 | £25.00 | 7 | £71.42 |
Focusing on cost per conversion, it’s obvious that campaign two is the top performer. Any marketer wanting to make a big impact would invest their money into campaign two.
But before we get ahead of ourselves, let’s apply revenue and opportunity data.
Below is click and conversion data for three separate LinkedIn campaigns.
| Campaign | Cost | Clicks | CPC | Conversions | Cost per conversion | Opportunities | Closed deals | Closed revenue |
| Ad campaign 1 | £500 | 70 | £7.14 | 12 | £41.66 | 9 | 5 | £3,591 |
| Ad campaign 2 | £500 | 100 | £5.00 | 20 | £25.00 | 3 | 1 | £399 |
| Ad campaign 3 | £500 | 20 | £25.00 | 7 | £71.42 | 1 | 0 | £0 |
How the tables have turned.
When we add revenue data, we can now see that campaign one had the best overall influence on the business, even though campaign two generated more conversions.
Now, don’t get us wrong.
We’re not saying cost per conversion or cost per click is worthless. They both have their place in Campaign Manager.
But if we have learned anything from our example, it makes a lot more sense to focus on the ad campaigns that lead to actual opportunities and revenue rather than just conversions and clicks.
How we measure the LinkedIn Ad campaign performance
Up to now, we’ve highlighted the metrics available in LinkedIn Campaign Manager.
We also know that cost per conversion and CPC isn’t always the right answer and that revenue data is critical in demonstrating the value of your ad campaigns.
For the second half of this blog, we’re going to show you how we track our LinkedIn ad performance using marketing attribution, CRM and revenue data.
In this demonstration, we’ll use the following tools and integrations:
- LinkedIn Campaign Manager
- Google Sheets
- Ruler Analytics
- Insightly
- Google Analytics
- Chartmogul
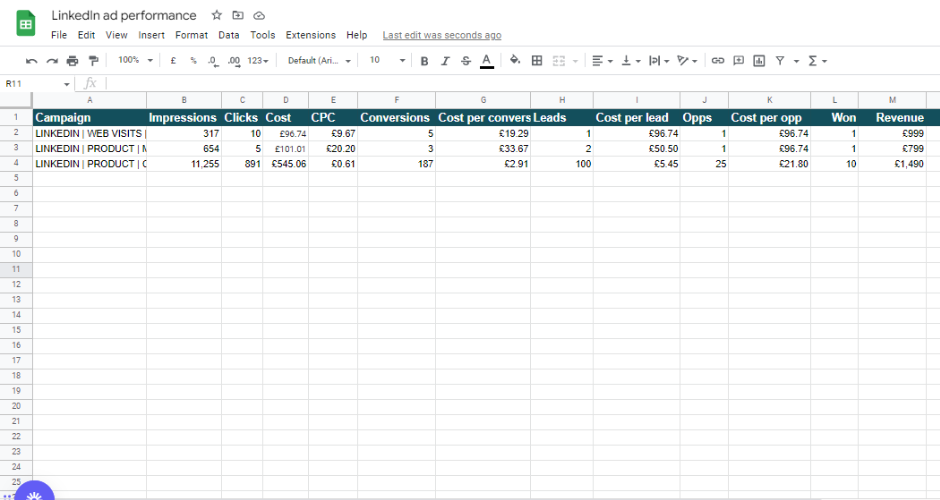
1. Export ad performance data from LinkedIn Campaign Manager
The first step in this process is to export our ad performance data from LinkedIn Campaign Manager.
We log into Campaign Manager, navigate to our campaign dashboard, set the appropriate time frame and click export.
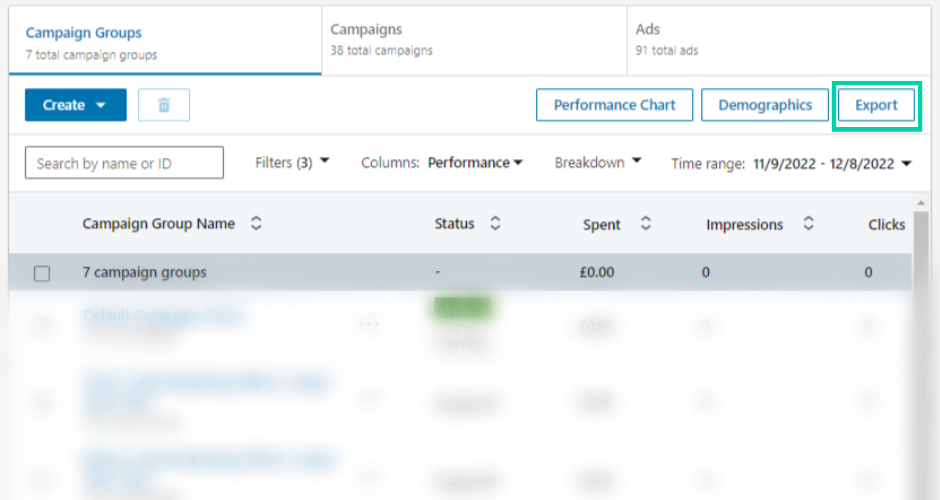
This export will provide us with all the necessary data and metrics we need to track our revenue per click and cost per acquisition later in the process.
Once the export is complete, we copy and paste the necessary data into our overall reporting doc.
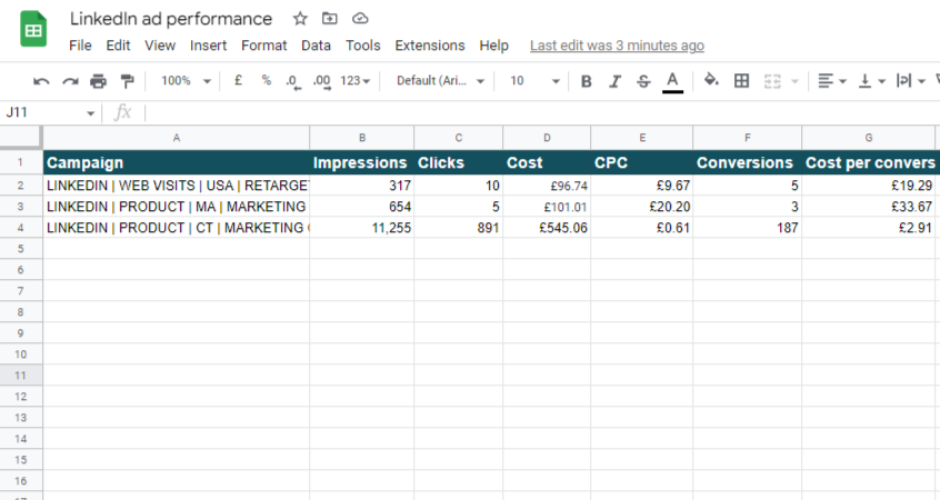
Note: The numbers in this example are fictitious and are only used here as an illustration.
2. Track anonymous visitors over multiple sessions and traffic sources
To understand what users do after they click a LinkedIn ad, we use Ruler Analytics.
Ruler allows us to isolate activity down to specific users. It tracks each and every user at a visitor level, both known and anonymous.
Related: How to view full customer journeys in Ruler
Take the example below.
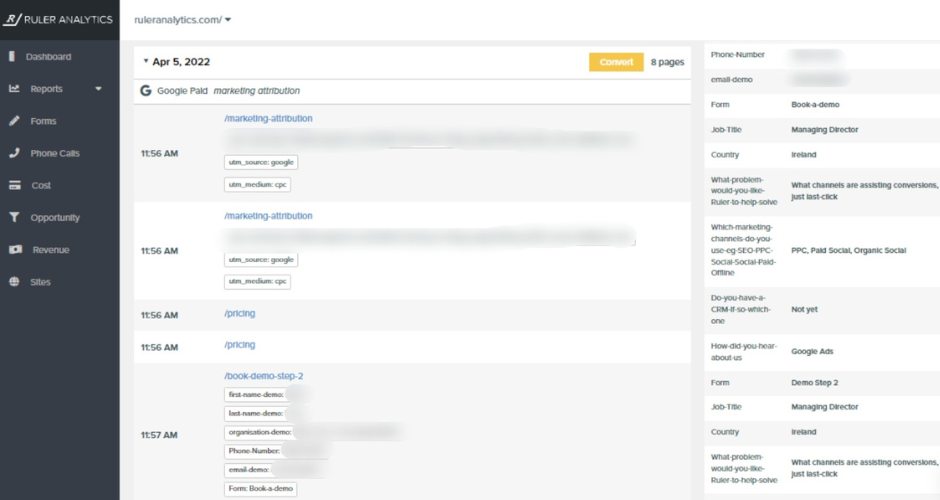
We can see that a user clicked on one of our ads and converted into a lead using a form.
Tracking visitors on an individual level is a crucial step in our process. It allows us to monitor and measure the movements of specific visitors and gain a clear picture of their journey from start to close.
Without visitor tracking, it would be impossible to understand what marketing touchpoints converted our visitors into leads and leads into closed-won deals.
3. Send lead source data to the CRM
With Ruler, the missing link between your marketing and revenue is effectively restored.
After we’ve set up Ruler to track multi-channel attribution, we need to send this data to our CRM.
Passing attribution data to our CRM will allow us to see which LinkedIn ads have the greatest influence on pipeline generation.
Take the example below.
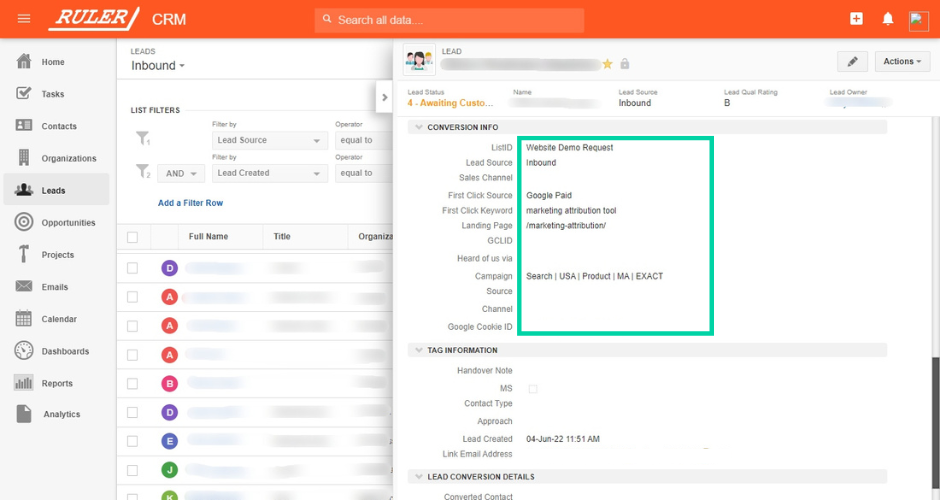
After applying Ruler’s data, we can see that this lead converted after clicking a Google ad about marketing attribution.
Without Ruler’s data, chances are our CRM would attribute leads to “Online” or “Web”.
Fortunately for us, that’s not the case.
Instead, we can track the effectiveness of specific ads and campaigns at every stage of the funnel, allowing us to spot opportunities and carry out informed decisions well ahead of time.
4. Match leads and opportunities with LinkedIn campaign data
Next, it’s time to match our leads and opportunities back to the campaigns that drove them in the first place.
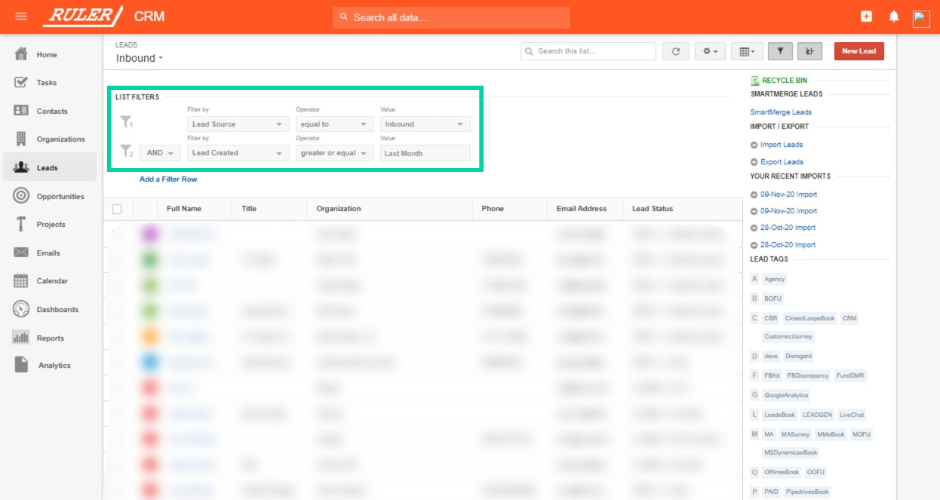
First, we need to export our leads and opportunities from our CRM.
As you’ve probably already guessed, we use Insightly to track and store our lead and opportunity data.
For lead data, we navigate to Leads > Filter leads by last month > export to excel. To export our opportunities, we head over to “Opportunities” and repeat the same steps we followed for leads.
After the export is complete, we first get to work attributing our leads.
To do this, we highlight all rows and create a pivot table.
For the pivot table, we select Rows > Campaign > Ascending.
Then, we select Values > Campaign > Counta.
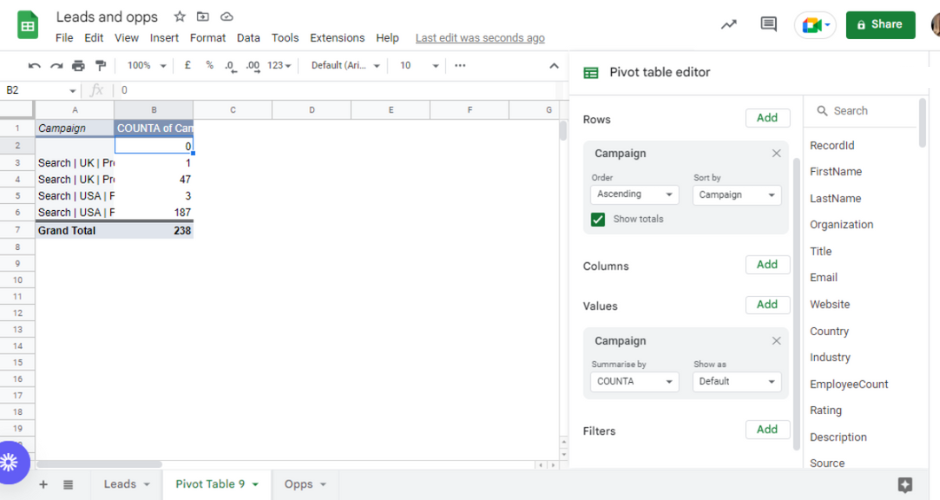
This should show how many leads each LinkedIn campaign has added to the pipeline. We then repeat the same steps for opportunities.
Once we’ve finished attributing our leads and opportunities, we copy and paste the data into our reporting document.
We also include cost per opportunity to understand how efficient our ad campaigns are at driving activity further down the funnel.
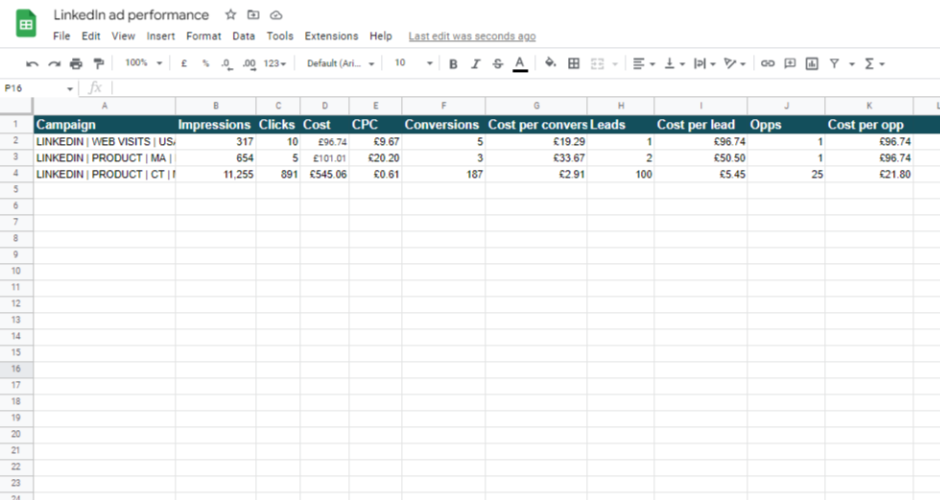
Note: The numbers in this example are fictitious and are only used here as an illustration.
5. Align marketing revenue with our campaign data
Tracking leads and opportunities is a great first step in determining the value of your LinkedIn ads.
But they shouldn’t be your primary measure of success.
To prove marketing’s worth to your CEO, you’ve got to report on the one metric that they care about most.
And that metric is revenue.
Related: How Ruler attributes revenue to your marketing
To find out how much revenue each LinkedIn campaign has generated, we segment our “Won” opportunities for the month into a new separate sheet.
We create a pivot table and follow the same steps: Rows > Campaign > Ascending.
But, once we get to Value, instead of selecting “Campaign“, we choose “BidAmount“.
This shows us how much monthly recurring revenue each campaign has added to the pipeline.
Once we’ve gathered this data, we add it alongside our engagement, lead and opportunity data in Google Sheets.
With revenue data in our report, we can build dashboards to demonstrate our performance against business metrics such as ROAS, CAC and ROI.
Note: The numbers in this example are fictitious and are only used here as an illustration.
6. Share revenue attribution data with other tools
As we’re a SaaS company, we rely not only on the deal that a user makes but their lifetime value too.
It’s important for us to track how our marketing increases the lifetime value of our customers.
To do this, we send our revenue attribution data to Chartmogul.
For those that don’t know, ChartMogul is a subscription analytics platform that allows you to track, analyse, and grow your recurring revenue.
In ChartMogul, we’ve set up custom attributes to capture Ruler’s marketing attribution data.
Related: How Ruler closes the loop with Chartmogul
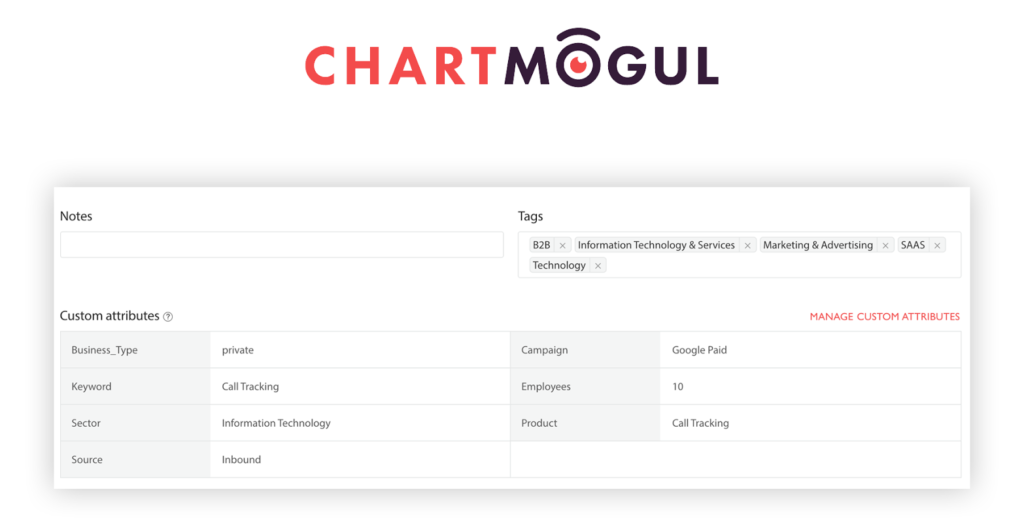
This allows us to manipulate data in Chartmogul to create custom reports to show which marketing sources and ad campaigns have the greatest influence on LTV.
Need help measuring your LinkedIn ad performance?
If you’re in B2B, LinkedIn ads are a no-brainer.
But without the right tools and data, measuring progress and showing the value of your ads is tough.
All you have to work with is cost per conversion and CPC. And while these metrics are readily available in Campaign Manager, they don’t tell you the whole story.
With tools like Ruler, measuring the impact of your LinkedIn ads on revenue is easy.
Ruler closes the loop between the deals that came in as a result of your LinkedIn campaigns. With it, you can track exactly what’s driving revenue and make better decisions to improve your ROI.
Want more info on Ruler? See how Ruler affects your paid strategy, or book a demo to get a more in-depth look at how it works.