Track your ad effectiveness the right way and gain better insights to drive higher-converting leads at a lower cost.
Tracking your ad performance is an absolute must.
If you don’t know what’s working, how can you make informed decisions to spend your marketing budget?
Do a quick Google search around measuring PPC performance, and you’ll find tons of metrics and techniques to track your ad effectiveness.
But what is the best way to accurately determine ad success and establish reliable tracking methods to gauge your reveueand ROAS?
Keep reading to find out.
What we’ll discuss:
- The importance of measuring your ad effectiveness
- The traditional way to measure ad effectiveness
- What are the best tools to measure ad effectiveness?
💡 TL;DR
– With the rising cost of PPC, the ability to track ad success is more important than ever, to make sure every pound matters.
– Tracking ad performance historically revolved around monitoring the number of MQLs generated and calculating the cost per lead as a primary key performance indicator.
– The MQL metric is not a reliable indicator of campaign success because it’s not aligned with closed-won deals or revenue and doesn’t take into account the quality of leads.
– To truly understand the value of your ad campaigns, you need to track metrics that are aligned with your business goals, such as SQOs and revenue.
– By linking up your ad platforms, CRM, and subscription analytics through attribution tracking, you can gain a clear understanding of which ad platforms and campaigns are driving the most valuable deals, and demonstrate your impact on revenue more effectively.
The importance of measuring your ad effectiveness
The era of cheap digital ads is long gone.
Paid advertising was once an inexpensive way of generating traffic and leads. But it’s now considered a costly expense, with some of the most popular keywords costing upwards of £75 per click.
According to ad-buying firm AudienceX, CPCs for search ads on Google were up 12% year-on-year for the first quarter of 2022.
With the rising cost of PPC, the ability to track ad success is more important than ever, to make sure every pound matters.
And with a solid strategy to track ad effectiveness and measure results, you’ll be able to:
- better understand the role your campaigns play in the overall customer journey
- allocate budget towards your highest converting campaigns
- minimise wastage in your PPC campaigns
- lower the cost you pay for each click
- drive a higher ROI and ROAS.
The traditional way to measure ad effectiveness
Tracking ad performance historically revolved around monitoring the number of MQLs generated and calculating the cost per lead as a primary key performance indicator.
The traditional belief was that increasing the number of MQLs at the top of the funnel would increase the chances of closing more deals. But this simply isn’t enough.
While tracking the number of MQLs is a great way to understand how your ads are working, it isn’t a reliable metric to track your progress on growth.
The MQL metric is not a reliable indicator of campaign success because it’s not aligned with closed-won deals or revenue. It doesn’t take into account the quality of leads, which is a critical factor in determining the success of your ad campaigns.
Just because you’re generating MQLs at a reasonable cost doesn’t mean you’re generating more profit. In fact, you’re likely doing more harm than good by wasting your budget by filling up the pipeline with low-quality leads.
To truly understand the value of your ad campaigns, you need to track metrics that are aligned with your business goals, such as SQOs and revenue. Once you achieve this, you can make informed decisions about your ad campaigns and improve their performance over time.
What are the best tools to measure ad effectiveness?
We know that MQLs are not always a reliable indicator of success, and that revenue metrics are essential for demonstrating the health of your ad campaigns. The next step is to find the right tools to help you track your ad performance metrics.
For us, we use the following tools and integrations.
- Google Ads
- Google Sheets
- Ruler Analytics
- Insightly
- Chartmogul
1. Export ad performance data from Google Ads
First, we need to export our ad performance data.
For this example, we’re going to use Google Ads, but this step-by-step guide applies to any ad platform.
We log into Google Ads, navigate to our campaigns, set the appropriate time frame and click export.
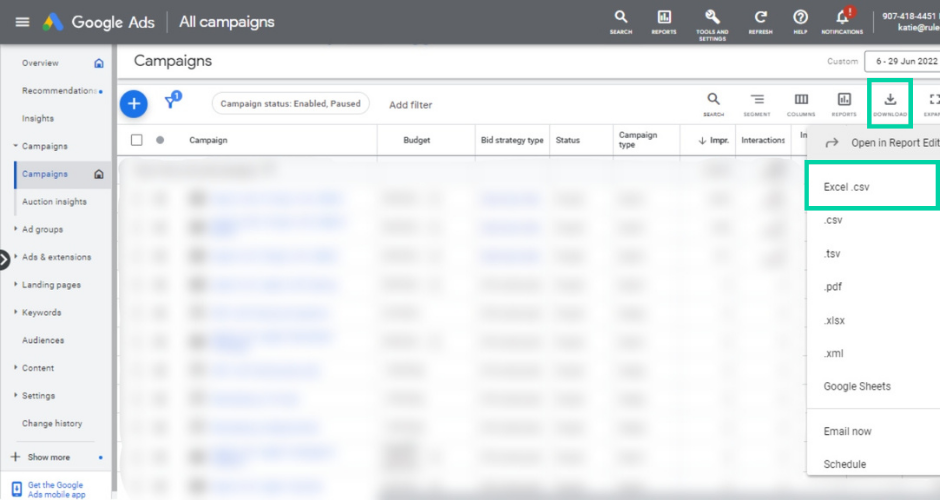
This export provides us with all the necessary data we need to better calculate cost per acquisition and ROAS further down the line.
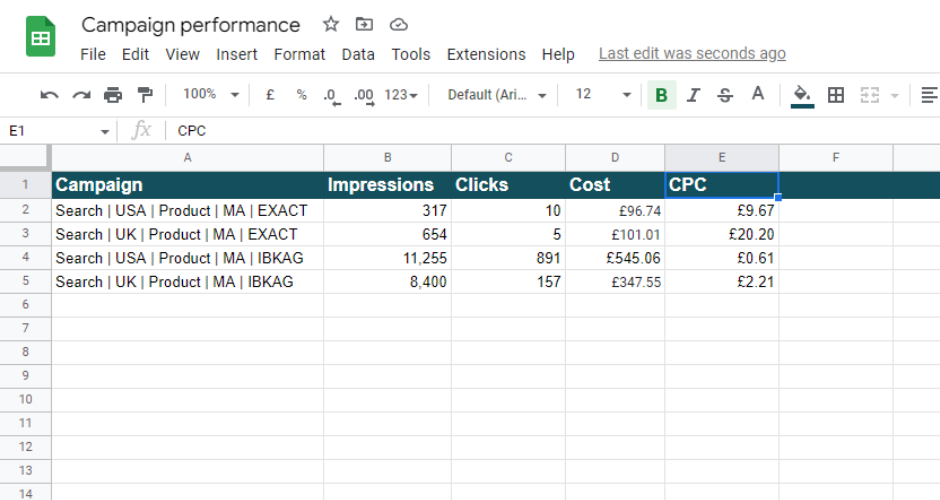
Once the export is complete, we copy and paste the necessary data into our overall reporting doc.
Note: The numbers in this example are fictitious and are only used here as an illustration.
2. Track anonymous visitors over multiple sessions and traffic sources
We use our marketing attribution platform Ruler to track each and every user at a visitor level, both known and anonymous.
Now you’re probably wondering why anyone would consider using another analytics tool when we have free access to Google Analytics.
We wouldn’t blame you for thinking about it. Google Analytics is king when it comes to marketing performance tracking.
90% of marketers would agree as they consider Google Analytics their go-to choice for marketing measurement.
While Google Analytics offers tons of insights on your website and marketing performance, it is still somewhat limited.
Related: What are the limitations of Google Analytics
One significant downfall of Google Analytics is that the data is anonymised.
In other words, you’re not able to find a specific user, where they came from, or what they did on your website.
Without individual data points, the process of connecting visitors, leads and customers is difficult, if not impossible.
Ruler, however, allows us to isolate activity down to specific prospects.
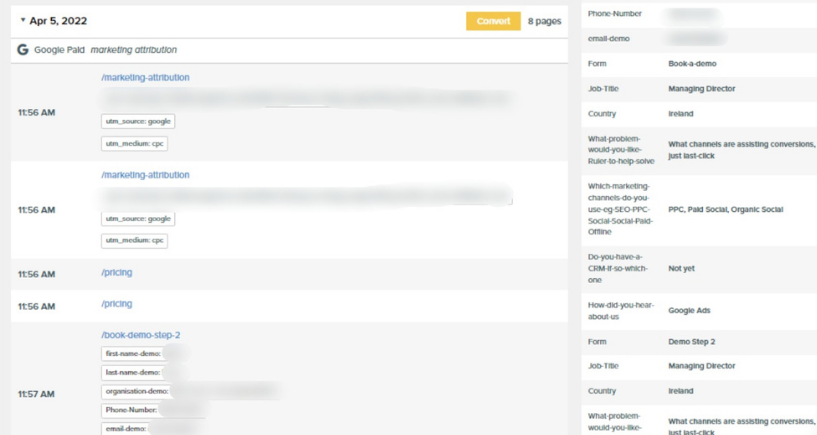
In the example above, we can see that a user clicked on one of our marketing attribution ads and converted into a lead using a form. Having complete access to conversion and marketing touchpoint data allows us to gain full visibility into where our most valuable leads are coming from and better track our cost per acquisition.
💡 Learn more about Ruler’s customer journey tracking
Tracking customer interactions across multiple channels unlocks powerful insights that you can use to improve your customer experience and marketing efforts. See how Ruler can help you follow the complete lifecycle from awareness to loyalty.
How Ruler tracks full customer journeys
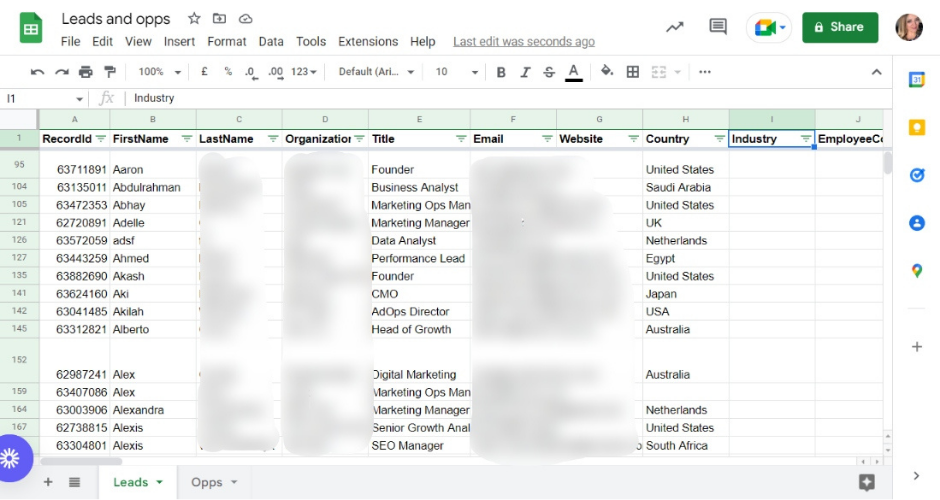
3. Export leads and opportunities from the CRM
Once we’ve exported our ad performance data and set up attribution tracking, we need to export our lead and opportunity data from our CRM.
Here at Ruler, we use Insightly to track and store our leads and opportunities.
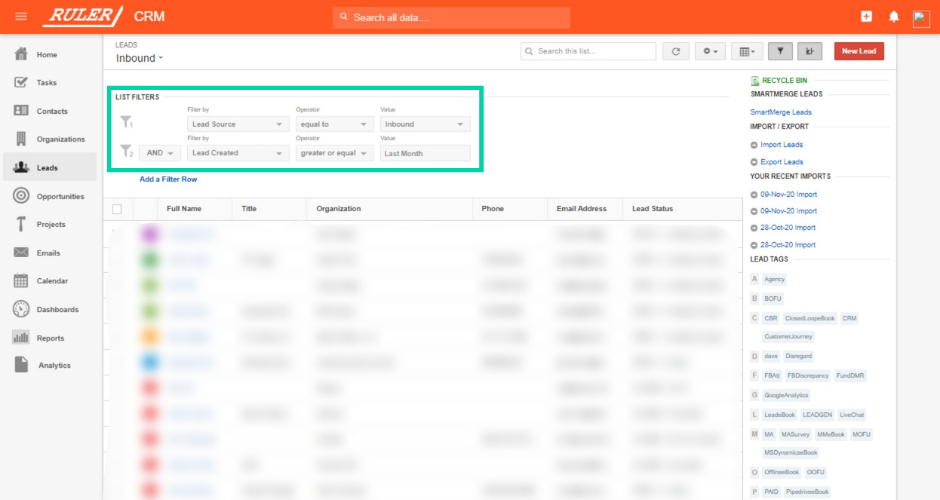
We first navigate to Leads > Filter leads by last month > export to excel. For opportunities, we head over to “Opportunities” and repeat the same steps we followed for leads.
Integrating Ruler with Insightly, we can seamlessly track the source of our leads and sales in our CRM without having to do any manual work.
Related: How to send lead source to the CRM with Ruler
For example, here’s what a lead record would look like in Insightly if we were to rely on a tool like Google Analytics.
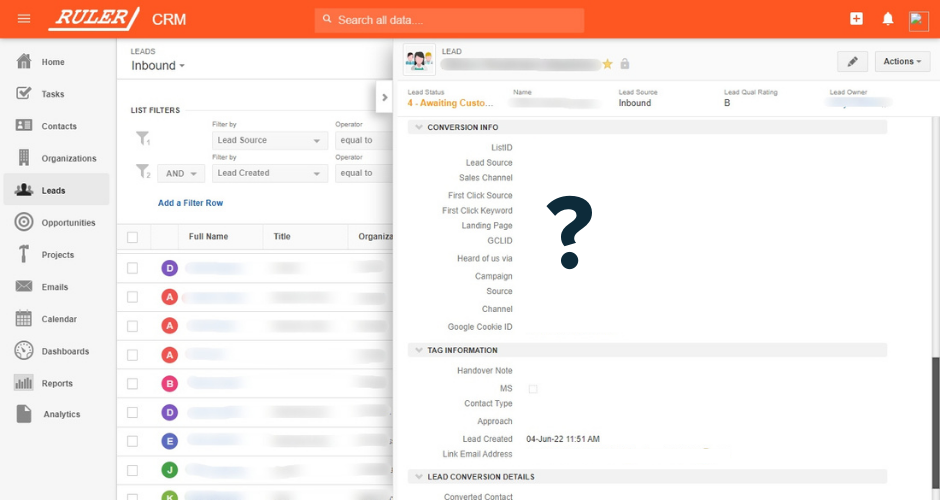
You can see the generic contact details, but there’s nothing about where the lead came from or what ads they engaged with before completing a conversion.
Now let’s apply the attribution data we’ve captured in Ruler.
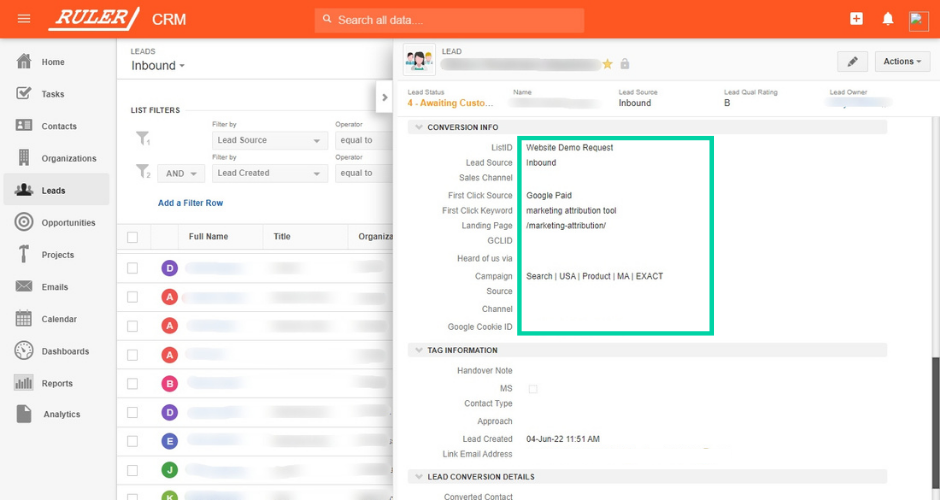
Applying data from Ruler, we can see that this lead converted after completing a PPC search and converted on our marketing attribution product page.
As this lead moves through the pipeline, we can make better conclusions about our ad campaign performance.
For example, we may find that a campaign is driving many conversions, but when we look at the CRM, we may discover that these conversions are low quality and rarely make it past the opportunity stage.
In essence, Ruler allows us to track the ad campaigns that are having the biggest impact on our pipeline generation and plays a significant role in driving our revenue growth.
4. Match leads and opportunities with ad performance data
Now that we’ve exported our data from Insightly, our next job is to match our leads and opportunities back to the Google Ad campaigns that drove the initial interest.
For leads, we highlight all rows and create a pivot table.
For our pivot table, we select Rows > Campaign > Ascending.
Then, we select Values > Campaign > Counta.
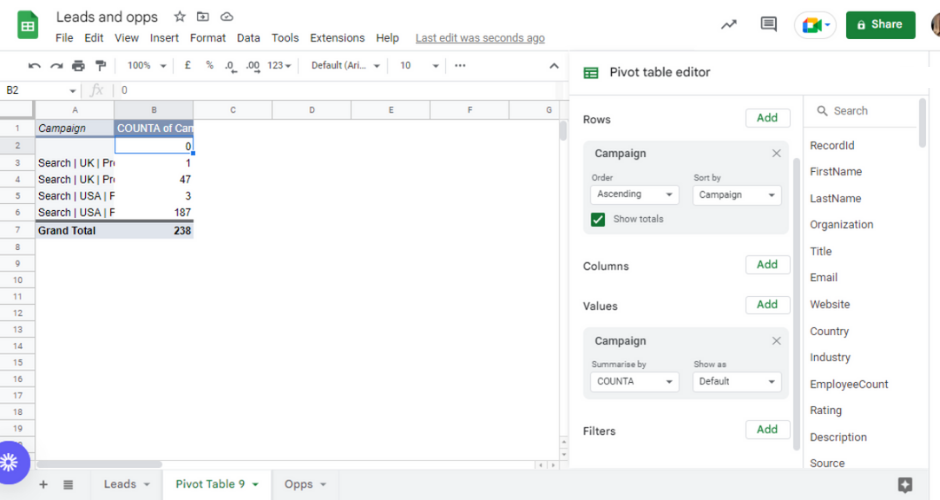
This should display how many leads each ad campaign has generated for our company. We repeat the same process for our opportunity data.
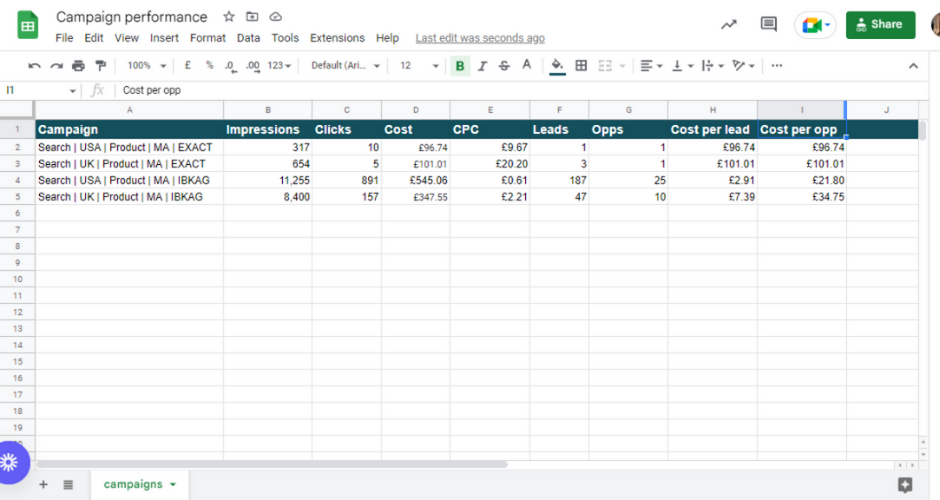
Once we’ve generated our lead and opportunity data, we input these numbers against the campaign data we exported from Google Ads.
Note: The numbers in this example are fictitious and are only used here as an illustration.
4. Align marketing revenue with our campaign data
As we’ve highlighted many times, MQL metrics are irrelevant when measuring the success of your ads.
What matters most is how your campaigns translate into revenue.
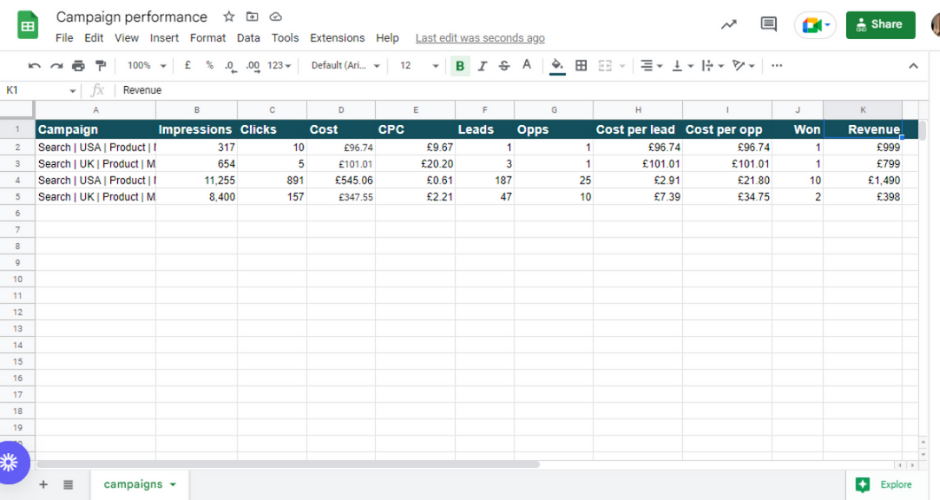
To find out how much revenue each campaign has generated and track our ROAS, ROI and CPA, we segment our “Won” opportunities for the month into a new separate sheet.
We create a pivot table and follow the same steps we used for leads and opportunities: Rows > Campaign > Ascending.
But, once we get to Value, instead of selecting “Campaign“, we choose “BidAmount“.
This shows how much revenue each ad campaign has added to the pipeline.
Once we’ve gathered this data, we add it alongside our web, lead and opportunity data in Google Sheets. If done correctly, we should be able to see the ad campaigns that have had the greatest impact on revenue and better track our ROI and ROAS.
Related: How Ruler attributes revenue to your marketing
Note: The numbers in this example are fictitious and are only used here as an illustration.
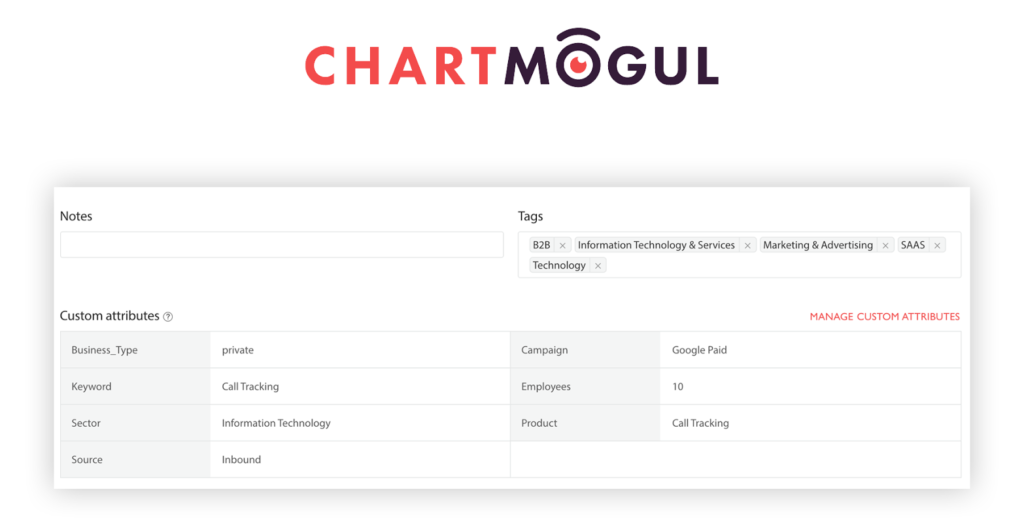
5. Send marketing attribution data to Chartmogul
As we’re a SaaS platform, we rely on monthly subscriptions from our customers for most of our income.
We use ChartMogul to track changes in revenue from our customers and lifetime value.
In ChartMogul, we’ve set up custom attributes to capture Ruler’s marketing attribution data.
This allows us to manipulate data in Chartmogul to create custom reports to show which marketing sources and ad campaigns have the greatest influence on LTV.
Related: How Ruler closes the loop with Chartmogul
Need help measuring your ad effectiveness?
As a marketer, it’s in your best interests to figure out which ad campaigns are driving the most profitable outcomes.
Without the right tools and metrics, you would have no means to track your paid efforts and risk making the wrong decisions that could lead to lost revenue.
Take Ruler, for example. Without it, we’d have no understanding of our ad effectiveness and would likely lose focus on what matters the most to our business.
Want more info on Ruler? We have plenty of content on how Ruler affects your paid strategy.
Or, if you want to see Ruler in action for yourself, book a demo and get a more in-depth look at how it can help with your marketing measurement.