Use these Google Analytics metrics and measure the value of your marketing campaigns more effectively.
Google Analytics is second to none when it comes to helping marketers understand the figures and performance behind their campaigns.
“It shows a complete scenario of your website performance with the data compiled from different metrics,” says Deepa Jatania, Media Head at e-intelligence.
There’s a plethora of metrics that you can choose from in Google Analytics to track marketing effectiveness.
But, by tracking the metrics that matter, you can make important decisions that will help drive your business forward.
In this article, we take a look at the top metrics you can track with Google Analytics, where you can find them, plus discuss the benefits of using Google Analytics to track marketing performance.
What you’ll learn:
- What is a metric in Google Analytics
- Why you should use Google Analytics to track metrics
- What you can do with Google Analytics
- What key metrics you can get from Google Analytics
💡 Pro Tip
Imagine if you could track ROI in Google Analytics for your leads and offline conversions? Now you can! With our free guide, you’ll learn how to track revenue and break it down by different dimensions such as traffic source, landing page and location.
Download how to unlock marketing revenue in Google Analytics
What is a metric in Google Analytics?
You’ll likely know what a metric is in Google Analytics, and what one looks like. But for the sake of clarity, here’s a refresher.
A metric in Google Analytics is a quantifiable measure used to track progress and evaluate success of your marketing. Google Analytics metrics include, but aren’t limited to:
- Users
- New users
- Sessions
- Bounce rate
- Pages/sessions
- Average session duration
These metrics, and others, are compared with dimensions to show more detailed insights into the success of your marketing endeavours.
To put it simply, dimensions in Google Analytics are qualitative attributes associated with your visitors.
Browser, landing page, campaign and channel are just a few examples of dimensions in Google Analytics.
While users are an important metric to track, you can instead measure your users against a specific marketing source.
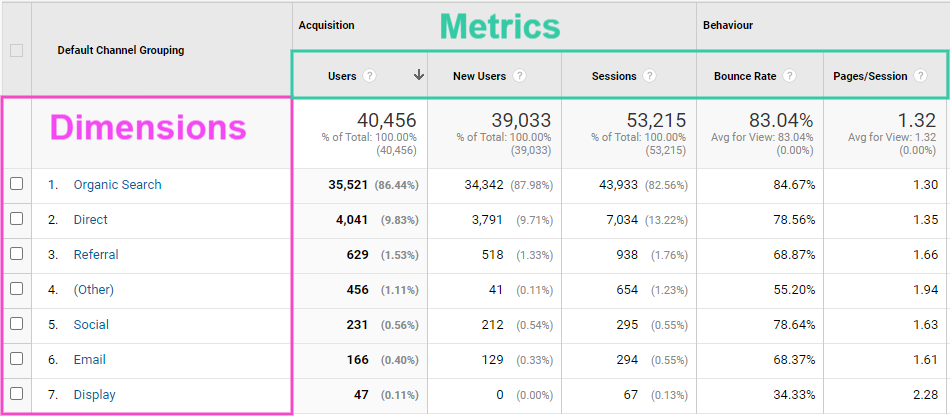
In the example above, you can see that the organic search has generated 35,521 users. This gives a good indication of your SEO performance and allows you to understand which channels are working harder to drive more traffic.
Why use Google Analytics to track metrics?
“When it comes to marketing metrics, the best way to keep tabs on your progress is by using Google Analytics,” says Chris Von Wilpert, Founder at Content Mavericks.
For businesses online, Google Analytics has always been the tool of choice for measuring marketing campaigns.
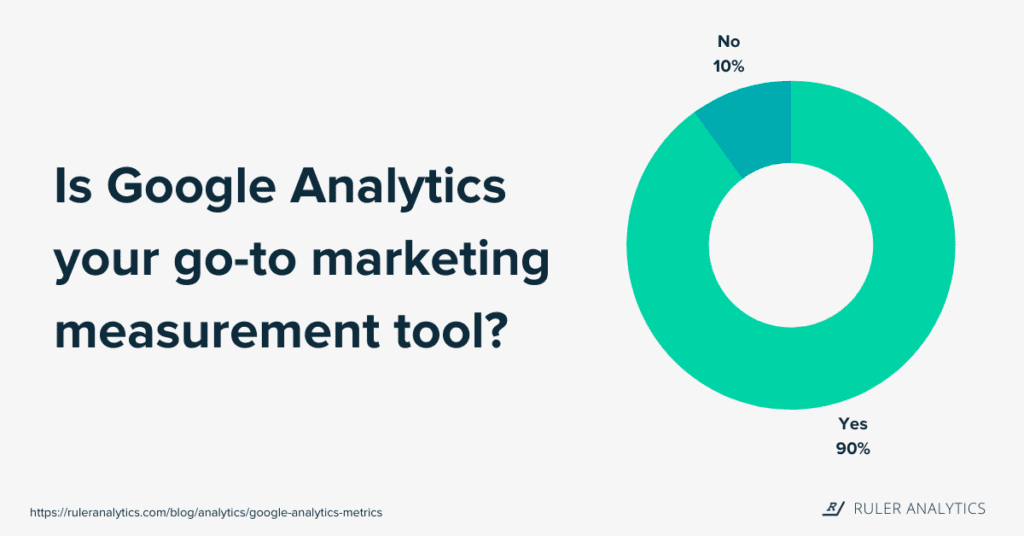
In fact, according to our survey, 90% of marketers consider Google Analytics their go-to choice for marketing measurement.
But with all the other marketing analytics tools out there, what makes Google Analytics stand out?
It’s free and simple to gain access
Most—if not all—analytics tools require a fee or licensing charge.
But not Google Analytics.
There is no subscription or monthly fees for the standard version of Google Analytics.
That means small to medium-sized businesses can enjoy Google Analytics’ advanced features without worrying about any extra costs or set-up fees.
Tracks what pages are most popular (and unpopular)
Landing pages play a significant role in ensuring the success of your marketing campaigns.
It’s believed that a good landing page can convert 50% of its visitors into qualified leads.
Monitoring your landing pages in Google Analytics allows you to track what’s working and make adjustments to improve conversion rates and performance.
“We keep an eye on our top ten landing pages so we can see which pages are drawing in traffic and getting the most attention. We ensure the content on those pages is high quality, up-to-date, and use the winning formula to design our other content,” says David Aylor, CEO at David Aylor Law Office.
Shows which channels drive the most traffic and conversions
Without behavioural data, you can’t track your website visitors’ specific movements or where they came from.
With Google Analytics, marketers can gain a wealth of information about how users find and interact with your website.
And when you understand how your users interact with your website, you can make more data-driven decisions to improve your customer experiences.
Related: A complete guide to data-driven marketing
“Source reports are the most useful in Google Analytics and can inform you of the source of your web traffic,” added Jordon Scrinko, Founder & Marketing Director at Precondo.
Provides reliable data to support informed decision making
Google Analytics is the most popular digital analytics tool in the world right now.
But it’s also one of the most reliable solutions.
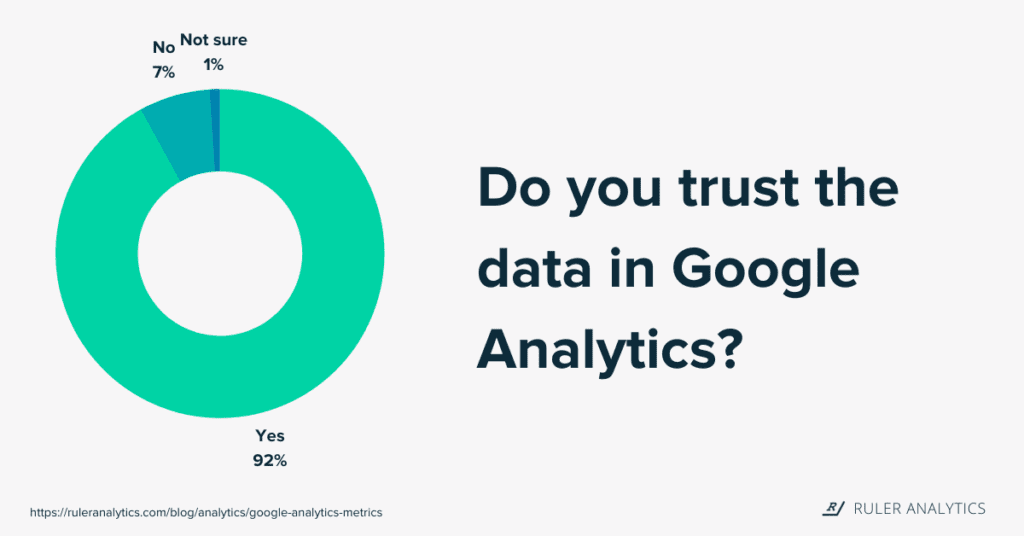
During an additional survey, we found that 92% of marketers are putting all their trust in Google Analytics.
“We find that the data from Google Analytics to be accurate and trustworthy. The figures align with our marketing forecasts and reflect what our readers say about our content,” says CEO and Co-Founder Johannes Larsson.
No analytics tool out there is perfect, and they all come with limitations, including Google Analytics.
Related: Limitations of Google Analytics and how to overcome them
But, when implemented correctly, it’s believed that Google Analytics can measure over 95% of genuine visitors.
What key metrics can you get from Google Analytics?
“Google Analytics continuously evolves its reporting capabilities, and certain metrics are crucial to track to identify strengths, weaknesses, and opportunities on your site,” says Isabella Zhou, Marketing Lead at Trustana.
There are hundreds of metrics available in Google Analytics, and they all measure something of value.
But which ones should you take interest in?
To help, we asked marketers to weigh and share their most important Google Analytics metrics for measuring marketing performance.
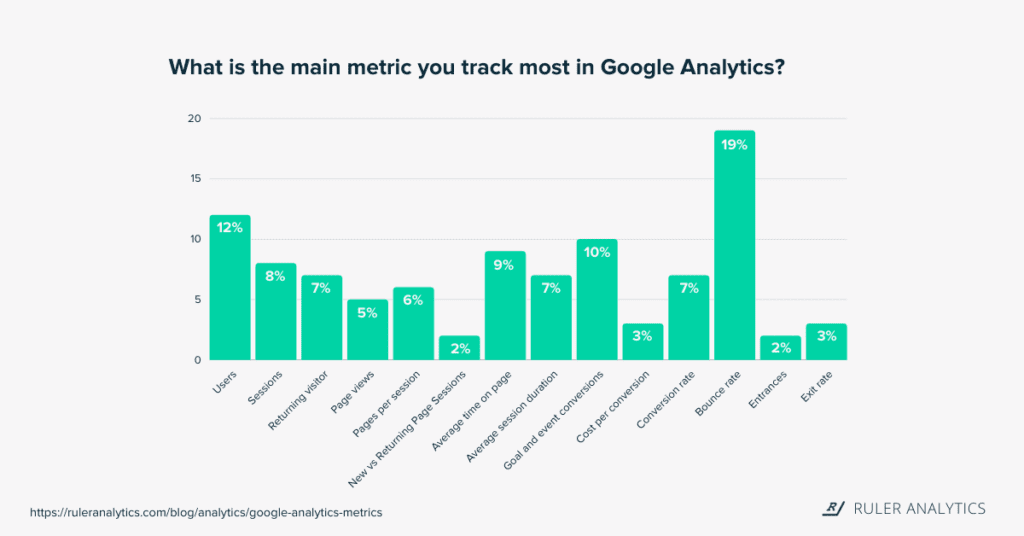
Here’s what they said:
- Users
- Sessions
- Returning visitor
- Page views
- Pages per session
- New vs Returning Page Sessions
- Average time on page
- Average session duration
- Goal and event conversions
- Cost per conversion
- Conversion rate
- Bounce rate
- Entrances
- Exit rate
Users
In Google Analytics, the user metric represents the “number of unique individuals who visit your website over a specified period,” says Brice Gump, Digital Marketing Expert at Major Impact Media.
Related: How to track individual users in Google Analytics
Google Analytics sets a cookie whenever a user enters your website and assigns them with a unique anonymous ID.
Tracking users is crucial. Not only for your website but your business too.
By monitoring the movements of specific visitors, you can better understand what pages and marketing sources are most useful in driving traffic and leads.
Patrick Smith, Editor-In-Chief at Fire Stick Tricks agrees: “Users provide valuable data on which pages get the most traffic and engagement. It gives me the data I need to make suitable adjustments to my website.”
💡 Pro Tip
Tracking user interactions across multiple channels unlocks powerful insight which you can use to improve your customer experience and marketing efforts. Download our guide on how to track customer journeys and learn how to follow the complete lifecycle from awareness to loyalty.
Download the guide on tracking customer journeys
The user metric is pretty much accessible throughout the entire Google Analytics reporting suite, as it’s displayed automatically.
However, you can find out more about who is interacting with your website by navigating to “Audience” > “Overview.”
Sessions
Unlike users in Google Analytics, sessions are characterised as the total number of visits to your site, including new and repeat interactions.
So, for example, a person could visit your website 50 times using the same device. In this case, Google Analytics would record this as one unique user and 50 sessions.
Tracking sessions are key as they allow you to assess whether your marketing campaigns are working to drive quality traffic and leads.
In fact, during a study, we discovered that 43% of businesses track the number of sessions to determine the success of their marketing efforts.
Nathan Bretherton, SEO Executive at Tao Digital, agrees: “Sessions give a more accurate view of how many people have clicked into a page and where/what they have done after they entered the site.”

If you have an average of three sessions per user, you’re likely doing a good job of directing users back to your site and keeping them engaged.
However, if you have 2 or less sessions per user, you might want to spend more time improving that figure.
John Li, Co-Founder and CTO at Fig Loans, relies on sessions to see how many users find their website helpful and return to their services.
“We know we’re not engaging with the right audience if our session numbers are really low comparatively,” says John.
Returning visitor
“Returning visitors gives me a good overview of how much stickiness the site has created as a brand, rather than a pageview machine,” says John Bedford, Founder at Viva Flavour.

As it says on the tin, a returning user is a visitor who has already been to your website and has started an additional session using the same browser and device.
Tracking returning users is a powerful metric for marketers who are interested in measuring visitor and customer satisfaction.
Page views
“I look at page views to determine what pages users interact with. Visitors won’t get far without interacting with at least one page on a website. You can look into things like session duration to see how long it is,” says Lee Atherton, Founder at Authority Guitar.
A pageview is when a page is loaded (or reloaded) in a browser. While pageviews can show you the number of times that page is viewed for a given period, in isolation, it provides little insight.
If you’re a blogger, then this metric can help you measure the impact of your content marketing efforts.
Pages per session
In Google Analytics, you can also see the number of pages a user views during a session.
Pages per session is a popular metric among marketers as “it tells you how engaged your visitors are with your content as they navigate through your website,” says Brogan Renshaw, Director of Firewire Digital.
Tracking the average number of pages per session is another useful way to measure and evaluate the performance of your visitor and customer experiences.
Shawn Plummer, CEO at The Annuity Expert, agrees: “Pages per session tells me how engaged users are with my blog and whether they’re continuing to read more articles or are bouncing quickly.”
New vs returning page sessions
New vs returning pages sessions is essentially a comparison of new users who have never been to your website vs users who have visited your site before.
“Since my website has a good number of visitors, I tend to look at which type of audience is liking my content. To know that, I check new vs returning page sessions. Here I usually look at the traffic size of each audience and later optimise my pages preferring to my major audience set (either new or returning),” says Ruggero Loda, Online Entrepreneur at Running Shoes Guru.
Average time on page
Next up, we have average time on page.
This metric essentially measures the amount of time spent on a single page by all users.
Average time on page is a good indicator of engagement. A high average time could indicate that users are interested in your content, products or services.
Founder at Absolute Reg, Jake Smith, agrees: “With average time on page, we can determine how engaged the users are towards our page contents.”

Jake added, “Using this as a metric allows us to identify our visitors’ amount of time on particular articles. If the average time is low, we can use it to identify opportunities to increase reader engagement by including videos and other multimedia content.”
Average session duration
“Average session duration indicates the average amount of time that each user spends on your website in a single session. This is vital information because it highlights user engagement,” says Joe Brown, Founder & Digital Marketing Strategist at Digital Junkies.
Simply, Google Analytics measures a session from the moment a user lands on your site up until they exit or become inactive for a predetermined amount of time.
Let’s say you’re in the SaaS industry and you want people to land on your book a demo page to learn more about your product.
A user lands on your homepage at 15:00.
They look at a product page and then your pricing page.
Eventually, they click on your demo page to request a call with your sales representative.
They leave at 15:20. In this case, the session duration lasted 20 minutes.
Goal and event completions
A goal or event occurs when an individual completes a desired interaction, such as filling out a form, making a phone call or downloading a whitepaper.
By tracking conversions, you can determine how well your marketing efforts are working in providing leads and sales.
Related: How to track conversions in Google Analytics
“Goal and event completions allow us to tie onsite user behavior to revenue, helping us to make more ROI-informed decisions,” says Kavi Kardos, SEO Manager at Moz.
Cost per conversion (lead)
Generally, cost per conversion is a marketing metric used to determine how well your campaigns are working to drive new leads.
Related: Cost per lead: Is your marketing effective?
“Cost per conversion is another valuable metric that provides data on how much we spent to acquire real customers. With cost per conversion, we can identify what marketing and advertising campaigns stand as crucial for conversions moving forward,” says Michelle Ebin, Founder at Jettproof.
To calculate the cost per conversion, you just take your total marketing spend and divide it by the total number of new leads.
While this metric offers some value, cost per conversion only takes you so far.
A conversion doesn’t guarantee revenue.
So, always be aware that your investment for each conversion or lead might not ever result in revenue.
💡 Pro Tip
Want to go beyond tracking conversions and leads? The best method is to focus on full-funnel tracking, and closed-loop marketing attribution can help. Closed-loop attribution takes out the legwork and automatically connects your closed revenue to your marketing channels, campaigns, keywords and more.
Download the closed loop attribution guide to get started
Conversion rate
Put simply, conversion rate is the number of conversions divided by the total number of visitors. For example, let’s say your site receives 100 visitors and generates 10 leads. In this case, the conversion rate would be 10%.
“Monitoring conversion rates is integral to tracking and optimizing the buyer’s journey,” says Stephen Light, Co-Owner and Chief Marketing Officer at Nolah Mattress.
Stephen added, “With Google Analytics, marketers can flag ‘events’ as a measure for conversion by ticking the “mark as conversion” option. This metric makes it easier to track conversions, measure whether goals are being met, and can even predict conversion rates, all of which is very useful data to a marketing team.”
While we’re on the subject, we ran a study into conversion rates across fourteen industries. Below is a graph that illustrates the average conversion rate per industry.
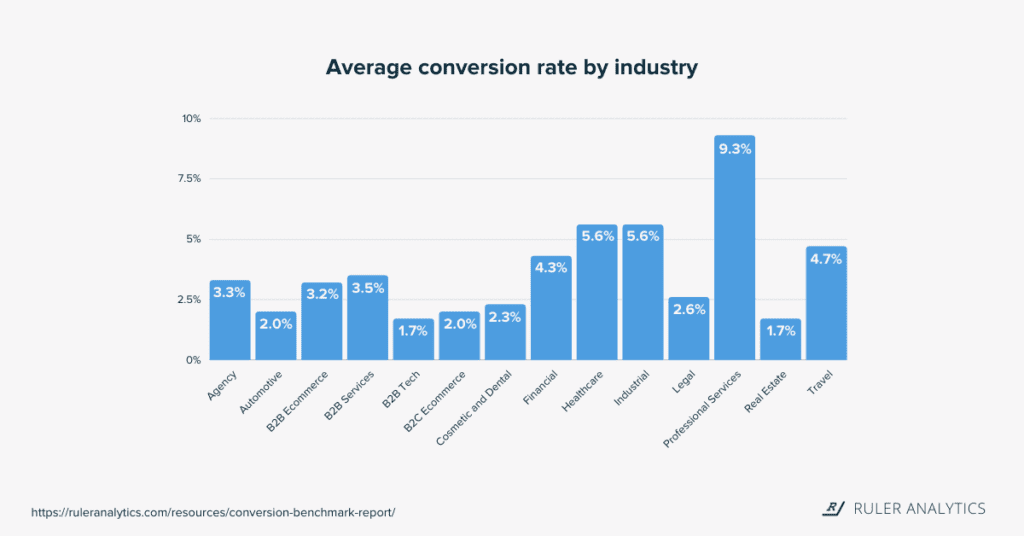
As you can see, performance varies across all industries.
It’s clear that industries that sell higher-value products and services have lower average conversion rates.
Something to keep in mind when tracking your conversion rates in Google Analytics.
💡 Pro Tip
Want to learn more about this study? Get your copy of the conversion benchmark report and track which channels have the highest conversion rates and assess how your form and call rates measure up against the competition.
Download the conversion benchmark report
Bounce rate
Bounce rate tracks whether users are navigating onto your website and quickly leaving without making an action such as clicking a link or filling out a form.
It’s calculated by the total number of one-page visits divided by the total number of entries to a website.
In essence, the lower the bounce rate of your website, the better.
Chief Experience Officer at Convincely, Gregory Yong, says a high bounce rate “might demonstrate that your website is poorly optimized, misleading to users, or simply unable to meet their needs.”

If you’re suffering from a high bounce rate, Gregory suggests segmenting your site visitors to determine the root cause of the problem.
“You might find that people using a certain browser might have a higher bounce rate than others. With this information, you can correct the issue and improve the overall user experience,” added Gregory.
Entrances
“Entrances measure the entrance points users visit your website through,” says Ed Cravo, Co-Founder and Head of Marketing at Groundbreaker.
Simply, entrances allow you to see the first page a user lands on when arriving at your site. They can tell you which pages are performing the best at the start of a visitor’s journey.
Unfortunately, GA4 has done away with entrances, but they are still available in the Universal Analytics Property.
Exit rate
Exit rate is the metric referring to the number of times visitors have left your site from a specific page.
Exit rate can supply you with insights into how people are behaving on your website and help you understand why visitors decide to leave.

“We look at the exit rate and can see specifically which pages may be dropping the ball. On those pages, we create a better call-to-action and tweak our content,” added Minesh Patel, Founder at The Patel Firm.
What have we learned from this guide on Google Analytics metrics?
There you have it, our list of the top metrics in Google Analytics.
While these metrics are tremendously useful to understand website efficiency, they aren’t connected to revenue-driven outcomes.
Revenue is the lifeblood of almost any business.
It is also important to track metrics that demonstrate your impact on wider company goals.
Marketing analytics tools like Ruler makes the job of connecting the topics between marketing and revenue easy.
Whilst tracking traditional metrics such as visits and conversions, Ruler gives you more visibility into your customer journeys.
Ruler tracks users on a visitor level, allowing you to match deals and revenue back to the marketing touchpoints that generated them across multiple channels, ads and keywords.
Related: How to view full customer journeys with Ruler Analytics
You can learn more about Ruler and how it helps marketers track and improve ROI. Or alternatively, book a demo and see Ruler in action for yourself.

This article was published in January 2022 and was last updated on 26th April 2022 for freshness.