
Most marketers have sat in a budget meeting where a channel gets cut because the numbers don’t justify the spend.
Often that channel wasn’t underperforming at all, it was just undetected to the tools measuring it. From the conversions we’ve tracked and the calls we’ve had with marketing teams, this is one of the most common, and costly, mistakes in modern marketing measurement.
Few customers make a big purchasing decision in a single session. They research across several channels, compare options, and often convert in ways that leave little trackable activity behind.
By the time a conversion happens, many of the touchpoints that shaped it have already dropped out of the attribution model. If you’re relying on GA4 and ad platform metrics alone to make budget calls, you’re working from an incomplete picture.
What you’ll find:
- What makes a channel “unmeasurable”
- Why you shouldn’t ignore what you can’t measure
- Ways to track the “unmeasurable”
- The importance of triangulating different methods
Pro Tip
This is exactly the gap Ruler is designed to close. Our first-party tracking captures calls, forms, live chat and other conversions and connects them back to the full customer journey, while our statistical modelling estimates the influence of channels that never get a click at all. Used together, they give you a much fuller view of what’s actually driving revenue. Book a demo to see how it works on your own data.
What makes a marketing channel “untrackable”
A channel becomes hard to track when there’s no clean, direct line between someone seeing it and someone buying from you. Paid social and CTV ads are good examples.
Someone might scroll past a video ad on their phone, think nothing of it consciously, then search for your brand by name three weeks later on a completely different device.
Standard analytics will often attribute the sale to that final branded search, because that’s the touchpoint it can actually see, and the ad that started the whole thing gets nothing.
Offline activity has the same problem, just in a different shape. Direct mail, radio and TV all sit outside what GA4 can see. And there’s another layer on top of that, when a prospect picks up the phone, speaks to your sales team, or walks into a showroom, none of that activity leaves a digital trail for GA4 to pick up either.
Existing customers often bypass digital entirely and get in touch directly, which means some of the highest-value sales in the business never show up against the marketing that actually influenced them.
From what we’ve found working with businesses on longer, more considered sales cycles, it’s rarely one single reason a channel is untrackable. It’s usually a mix of long consideration windows, conversions that happen offline, and cross-channel journeys that break the cookie chain somewhere along the way.
44% say cross-channel journeys, both online and offline, as a challenge for effective marketing attribution, and that figure lines up with what we hear in client conversations on a near weekly basis.
Why you shouldn’t ignore what you can’t measure
When a channel is hard to measure, it’s often the first thing that gets deprioritised when budgets tighten or someone asks for a clearer view of ROI.
Why keep funding something you can’t easily draw a straight line back to revenue? But this is exactly where growth starts to stall.
What we tend to find is that long-term, harder-to-measure channels get cut in favour of the things that show up neatly in a dashboard.
And for a while, that looks like the right call. The easy-to-measure channels keep performing, budgets get reallocated towards them, and everything seems fine, until it isn’t.
Inevitably, these channels hit a point of diminishing returns. You can only push so much spend into the same bottom-of-funnel activity before additional spend becomes progressively less efficient.
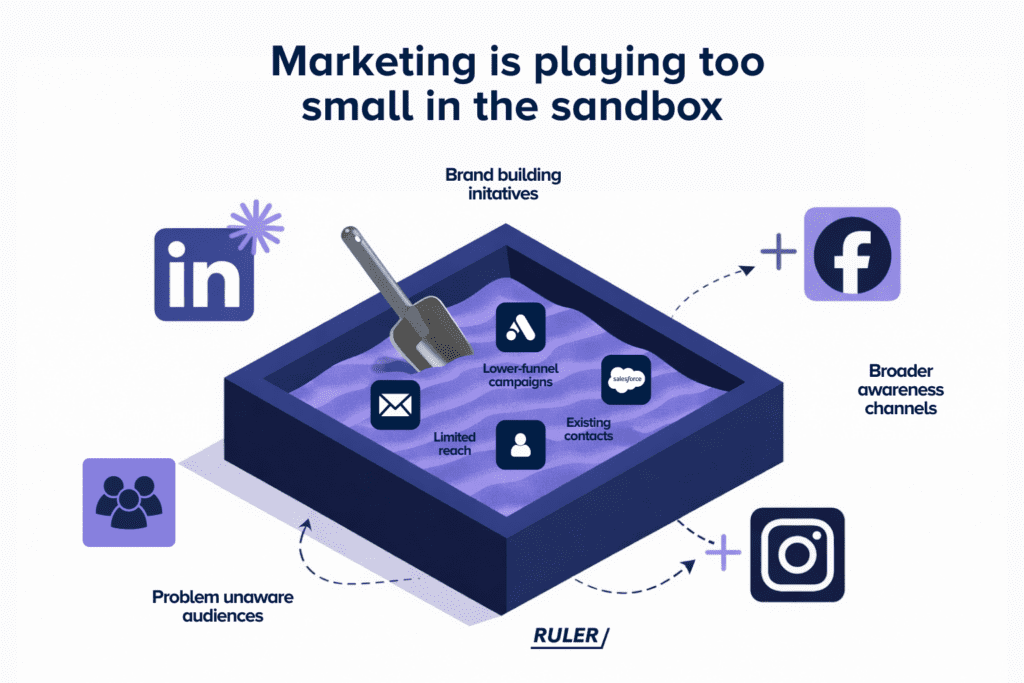
That’s usually when we start seeing conversions and revenue plateau, or in some cases start to slip backwards, and it’s rarely because the measurable channels themselves have stopped working. It’s because there’s nothing new feeding into them anymore.
The channels that are hardest to measure are often the ones doing the job of getting a brand in front of new audiences in the first place. They’re not designed to close the sale there and then, they’re designed to build the awareness and familiarity that eventually sends people down towards the channels that do get the value for the conversion.
Cut the top of that activity, and you shouldn’t be surprised when the bottom starts to dry up too, even if it takes a few months to show.
6 ways we measure untrackable marketing channels
There’s no single fix for this, but there are several established methods that, used well, get you much closer to the truth.
1. Pre/post baseline comparison
Look at your key metrics (branded search volume, direct traffic, leads) in the weeks before a campaign runs, then compare that against the same window after it launches.
It’s one of the simplest methods on this list, and it works particularly well for channels with a clear start and end date, things like out-of-home or podcast sponsorships, where there’s an obvious “before” to measure against.
To make this practical, pick your baseline window first (we’d suggest at least four weeks, longer if your sales cycle is longer) and write down the numbers before the campaign goes live, not after.
It’s surprisingly easy to forget this step and then be left trying to reconstruct a baseline from memory once the campaign’s already running. Keep other variables as steady as you can during that period too, so you’re not comparing a quiet baseline month against a particularly busy launch month for unrelated reasons.
2. Vanity URLs and unique phone or promo codes
These won’t capture every interaction, but they’re a low-effort way to connect specific campaigns to specific outcomes. They’re especially useful for print, radio or partnership activity, where a memorable code gives people an easy way to say “this is where I heard about you.”
In practice, this means setting up a dedicated code or URL for every offline placement before it goes live, not retrofitting one after the fact.
Keep a simple log somewhere central (a shared spreadsheet works fine) of which code maps to which placement and date, so when the enquiries start coming in, you’re not trying to guess which one drove them. It’s also worth briefing your team or call handlers to actually ask for the code, since a lot of the value gets lost if nobody’s capturing it at the point of contact.
3. Independent, first-party data tracking away from siloed ad platforms and incomplete analytics
Platform-reported numbers only ever tell you what that platform can see. First-party tracking that sits outside any single ad account, and follows a visitor’s full journey from the first click through to a form, offline activity and revenue, gives you a more independent view that isn’t shaped by any one platform’s incentives.
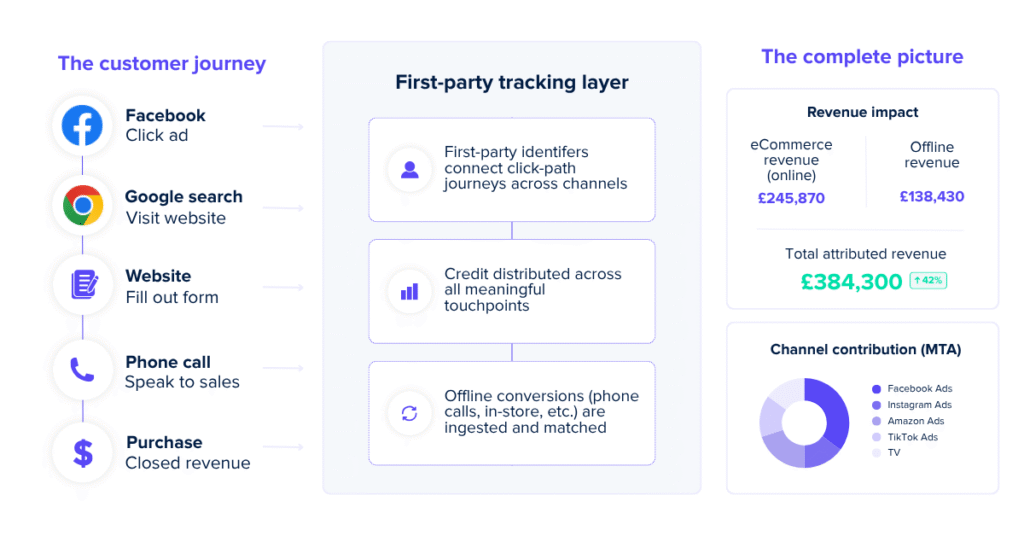
This matters most for offline activity. GA4 will happily tell you a person filled in a form, but it has no idea what happened to that person afterwards, whether they actually went on to close or not. And natively, it has no way of picking up when someone rings up or converts through live chat instead of filling in a form in the first place, so a whole slice of your conversions can end up undetected by default.
With first-party data, you get one unified view that sits above and beyond both the ad platforms and GA4, rather than another siloed number to reconcile.
And because it’s tracking the full journey and feeding that into whatever systems you use to manage customers or revenue, it can also send signals back the other way.
Once a conversion’s confirmed as qualified, or once revenue actually closes, that information can be pushed back to your ad platforms, even if your sales cycle runs over several months and the outcome only becomes clear well after the click.
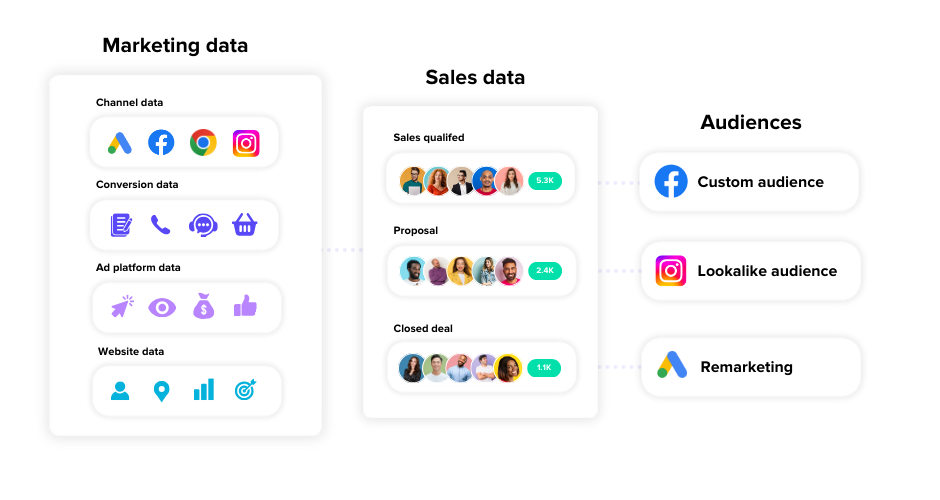
That gives the platforms something far more useful to optimise against than a simple form fill or click, and a much better basis for finding similar customers, rather than chasing more of the same low-quality conversions.
Pro Tip: Ruler tracks every visitor from first click through to form fills, calls, live chat and closed revenue, then pushes that data into your CRM and back to your ad platforms. That means you can see exactly which campaigns, keywords and channels are actually driving paying customers, not just leads or clicks, and you can prove it with your own numbers rather than platform estimates. Book a demo and we’ll show you what it looks like using your own data.
4. Statistical modelling for upper-funnel and offline influences
Marketing mix modelling looks at aggregate spend and outcome data over time, rather than trying to track individual clicks. It’s particularly well suited to channels like TV, radio and out-of-home, where a modelled estimate is often the only realistic option.
One of the things that makes it especially useful is that it can show you diminishing returns curves for each channel, not just what’s working, but the point at which extra spend starts losing efficiency.
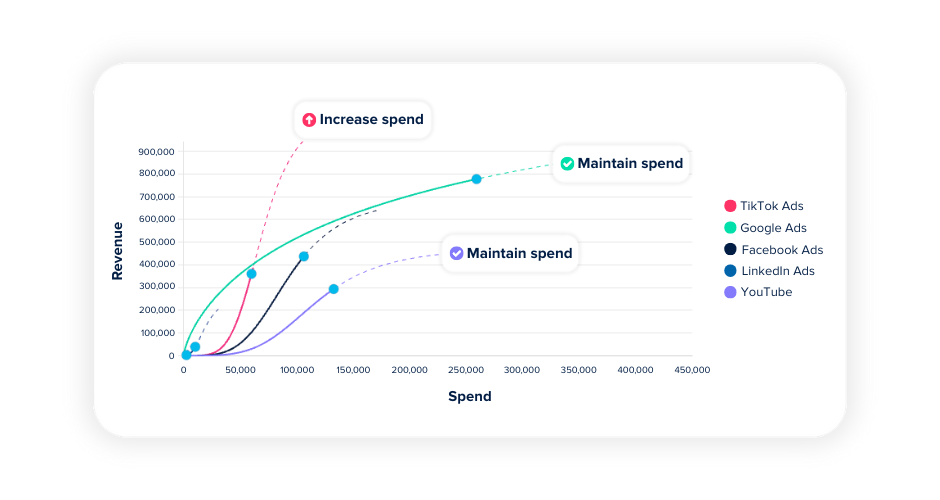
Rather than guessing when a channel’s maxed out, you can actually see it in the model, which makes forecasting and budget conversations a lot less theoretical.
We saw this play out with one of our own customers, an eCommerce health brand running paid media across Google, Meta, connected TV, Amazon, Walmart and QVC all at once.
Last-click attribution was giving Google credit for conversions that had really been influenced weeks earlier by a TV ad or a display impression, which made their upper-funnel channels look like they weren’t pulling their weight.
By modelling diminishing returns and marginal ROAS by channel, we were able to show that non-brand paid search actually had headroom for more investment, while also proving that TV, easy to dismiss as unmeasurable, was contributing 8% of total modelled revenue that would have been completely invisible in standard platform reporting.
This one takes a bit more investment to get right, but the clarity it gives you on hard to track channels like TV and offline media makes it worth the effort.
Pro Tip: We have a detailed case study on how this customer untangled TV, retail media and paid search into one model, including the exact diminishing returns curves that changed how they spent their budget. You can find that here.
5. Post-conversion surveys (“How did you hear about us?”)
Asking new customers directly how they found you is still genuinely useful, especially for word of mouth, offline events or brand awareness that no digital tool would otherwise pick up.
To get this working well, add the question at the point of highest engagement, so straight after checkout or right after a form submission, rather than in a follow-up email that half your customers won’t open.
An open-ended question lets people answer in their own words, which tends to surface things a fixed list would never have accounted for, someone mentioning a specific podcast episode or a colleague’s recommendation, rather than just ticking “referral” and leaving it at that.
It takes a bit more effort to read through the responses rather than tallying up a dropdown, but that’s usually where the more useful detail is hiding.
6. Incrementality testing (holdout and geo experiments)
Most measurement tells you what happened alongside a channel running.
Incrementality testing tells you what happens when it isn’t. Pause or reduce a channel in one region while keeping it running as normal in another, then compare the difference in outcomes between the two.
It’s the closest most marketers get to a genuinely causal answer on whether a channel is actually driving results, rather than just sitting there looking like it is.
How we triangulate different measurement methods for complete answers
No single method on its own gives you the full picture, and it’s worth being upfront about that rather than pretending one method can reliably answer everything.
Take “how did you hear about us?” surveys as an example. They’re genuinely useful, but they lean heavily on what a customer remembers and chooses to write down at that moment.
Someone might have seen a paid ad, read a blog post, then had a colleague mention the brand before they finally converted, but in the survey they’ll often just name the one touchpoint that stuck with them, usually the last or most memorable one, rather than the whole path.
But we know journeys are rarely that neat or single-channel, and self-reported answers are also just naturally prone to a bit of human error, people misremember, or genuinely aren’t sure themselves.
This is why we don’t rely on any one method in isolation. In our own approach, we tend to lean on three in particular, each doing a different job.
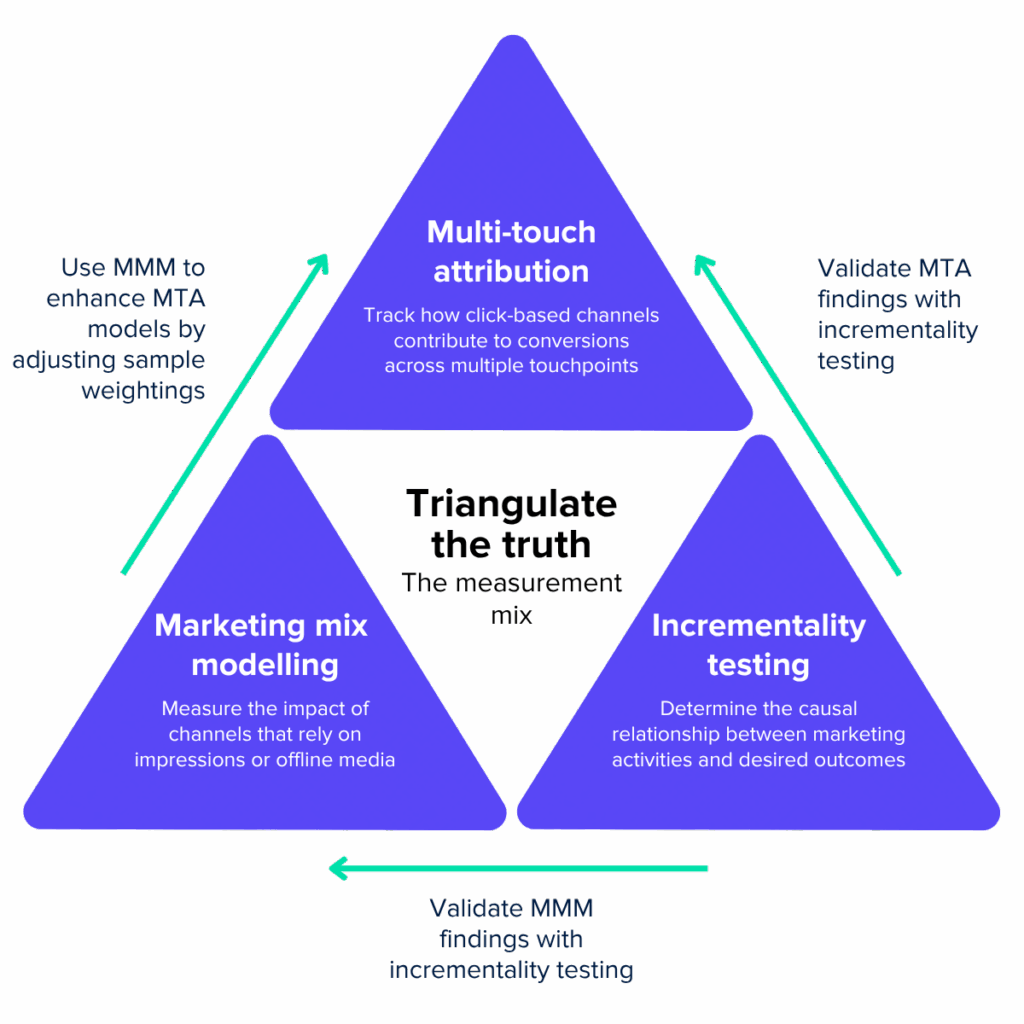
For example, incrementality testing is the closest thing we have to causal truth. Holding a channel back in one region and comparing it against another where it’s running as normal strips out a lot of the guesswork, because you’re seeing what actually happens when a channel is removed, not just what’s associated with it.
Marketing mix modelling gives us broad coverage across every channel, including the offline ones that are notoriously hard to track at an individual level, TV, radio, out-of-home and so on. It won’t tell you about a single customer’s journey, but it’s very good at showing the overall shape of what’s driving results across the whole mix.
Attribution, by contrast, gives us a fast, tactical read on what’s happening day to day. It’s not going to hold up as a definitive answer on its own, but it’s useful for spotting shifts early and making quicker calls without waiting weeks for a fuller model to catch up.
Used together, the three tend to cover each other’s blind spots. Attribution flags the day to day movement, marketing mix modelling fills in the broader and offline picture, and incrementality testing checks whether what the other two are suggesting actually holds up when you test it directly.
40% of marketers say more accurate data would improve their marketing outputs, and triangulating methods like this tends to be one of the more practical routes to getting there.
Need help with your hard-to-measure channels?
Hard-to-track doesn’t mean ineffective, it just means the standard tools weren’t designed to see it.
Once you start combining first-party tracking, statistical modelling, incrementality testing and a bit of direct customer feedback, a much clearer picture starts to form of what’s actually working.
If you want to see how this looks with your own data, book a demo of Ruler’s first-party tracking and we’ll walk you through how attribution and statistical modelling can work together for your business.
Hard-to-measure FAQs
How do you measure hard-to-track marketing channels? You combine several methods rather than relying on one. Pre/post baseline comparisons, UTM and unique codes, first-party tracking, statistical modelling, post-conversion surveys and incrementality testing each capture a different part of the picture, and layering them gives a more complete view than any single method alone.
What are the hardest marketing channels to measure? Channels with no direct click or clear conversion path tend to be the hardest to measure. That includes CTV, out-of-home, PR, podcasts, offline events and word of mouth, along with any channel that plays an early, upper-funnel role in a longer consideration journey.
How can you measure the ROI of hard-to-track marketing channels? Marketing mix modelling is usually the most reliable way to estimate ROI for these channels, since it looks at spend and outcomes over time rather than needing an individual click to track. Incrementality testing can then validate whether that modelled impact holds up in a real, controlled test.
How do you track marketing channels without direct attribution? Unique phone numbers, vanity URLs, promo codes and post-conversion surveys all give you an indirect way to connect a channel to a result. First-party tracking that follows a visitor’s full journey, rather than relying on a single platform’s cookie, also helps close some of the gap left by conventional attribution.
What tools can help measure hard-to-track marketing channels? Tools that combine first-party tracking, multi-touch attribution and marketing mix modelling in one place tend to work best, since each method covers a different blind spot. Ruler brings these together, matching first-party conversion data to CRM revenue while using statistical modelling to estimate the influence of channels that never generate a click.