
Knowing what is really driving marketing performance is hard enough when you run one or two channels.
Add paid search, social, connected TV, radio, retail partners and a sales team who take calls, and it becomes harder to see what’s driving results. Our research shows that 44% of marketers say cross-channel journeys, both online and offline, as a challenge for effective marketing attribution.
Marketing mix modelling keeps coming up in those conversations, yet hardly anyone talks about how it is applied in practice, and that’s the gap we want to fill.
Below, we walk through three real Ruler customers, what their modelling uncovered and what it meant for their budgets. No theory, just what happened and what you can take from it.
💡 Pro Tip
Ruler combines first-party data collection, attribution and statistical modelling to help you understand marketing performance across the whole customer journey. Marketing mix modelling adds a broader view of how every channel contributes to revenue, and it supports budget planning by showing where extra spend is likely to pay off. If you would like to see it using your own data, book a demo with the Ruler team.
Marketing mix modeling example #1: Health brand selling across ecommerce, retail and TV
Health brand: what the model found
Ecommerce, retail and TV in one framework, built on two years of spend and revenue data
Share of total modelled revenue
So what: Non-brand paid search had the strongest ROAS and still had room to grow, and TV’s contribution became visible for the first time.
Selling a health product across ecommerce, retail and TV at the same time is one of the trickier measurement problems we come across.
Our customer, a fast-growing health consumer brand, was running paid media across Google, Meta, connected TV, Amazon, Walmart and QVC all at once. The business was growing, but what was working (and what wasn’t) was getting harder to measure.
Part of the problem was Google. Last-click attribution meant it claimed a huge share of conversions, including sales that had really been influenced by a TV ad someone saw two weeks earlier, or a display ad they scrolled past before they knew they needed the product.
Upper-funnel activity was almost invisible in the numbers, so the channels building awareness looked like they weren’t pulling their weight. That had real consequences for budget decisions.
On top of that, a large part of their sales happened through Amazon, Walmart, Costco and QVC, sitting in a separate data silo from anything digital. Nobody could say how online advertising fed those retail purchases.
It is no surprise that only 48% of marketers are fairly confident in their ability to prove ROI, according to our research, because this is exactly the sort of set-up that makes proving it so difficult.
We built a marketing mix model covering two years of spend and revenue data, and for the first time online and offline sat in one framework.
One of the most useful outputs was the adstock and lagged effects analysis, which shows not just what converted but how long an ad’s influence lasts. For their DRTV activity, 85% of the impact carried forward beyond the week the ad aired. That is far more work than any click-based model would ever show.
We also layered in multi-touch attribution data across digital channels to build an impression model that properly weighted upper-funnel touchpoints, and we modelled diminishing returns curves for each channel.
The results were clear.
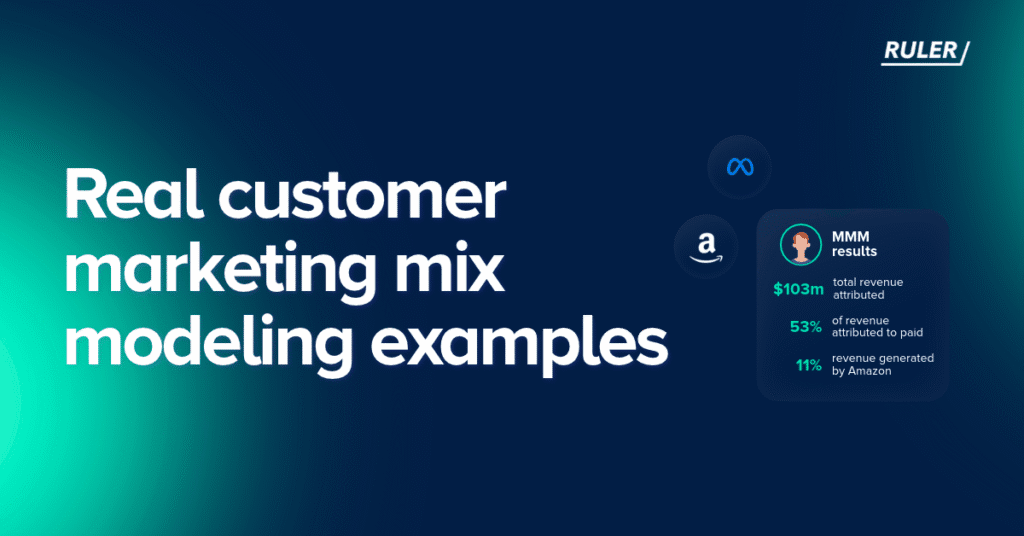
- The model attributed $103M+ in total revenue across the period, with paid media channels accounting for 53% of it. That gave the team a baseline they had never had before.
- Non-brand paid search had the strongest ROAS of any channel, on both reported and marginal spend, which means there is room to invest more before returns tail off.
- Amazon contributed 11% of total revenue, and the team could finally see how brand and performance activity flowed through to retail, not just their own site.
- TV, combining PITV and DRTV, accounted for 8% of total modelled revenue, a contribution that would have been invisible in standard platform reporting.
Marketing mix modeling example #2: Travel brand using digital advertising, offline sales and third-party agents
Travel brand: what the model found
Online, phone and third-party agent bookings unified through the CRM, using around 100 weeks of data
Third-party agents Direct, with phone or other offline steps Direct, fully online (~4%, about 10% of the 40% direct)
So what: Only a sliver of bookings finished online, so cost per enquiry was misleading. The team moved to revenue-based decisions, and CTV got a real ROAS figure leadership could see.
Some businesses are hard to measure simply because of how they sell. This travel brand sold holidays through its own channels and through independent third-party agents, with campaigns running across paid search, paid social, CTV and programmatic display. Bookings came in online, over the phone and via agents.
Most standard analytics tools were never designed for that level of fragmentation.
Roughly 60% of the company’s business flowed through third-party travel agents. Of the 40% that came direct, only around 10% completed entirely online.
So a lot of the bookings that mattered most commercially happened after someone had left the digital trail. They had seen the ad, visited the site, perhaps submitted an enquiry, and then picked up the phone or walked into a travel agency, or simply waited a few weeks.
For close to ten years, cost per enquiry had been the team’s main benchmark, because it was trackable. But Google and Meta would each claim the same leads, and a single customer submitting three tour enquiries in one session could appear in the data as three leads. The actual booking, the one with revenue attached, sat in a CRM, unconnected to any campaign.
There was another challenge coming from the top also. The company had invested in Connected TV for several years across two of its brands, and the marketing team and their agency genuinely believed it was working.
Proving it was another matter. CTV doesn’t generate clicks, so it sits in that upper-funnel space where the impact is real but the measurement usually isn’t.
Here is how the team brought it together.
- Unified revenue. Historical performance from paid search, paid social, CTV, programmatic, phone sales and agent bookings went into a single view, so ROAS could be calculated against real, deduplicated revenue.
- CRM integration. Offline and agent revenue was connected through the CRM, so phone and agent bookings sat in the same framework as online transactions.
- Marketing mix modelling. Around 100 weeks of data fed the model, which surfaced seasonality, budget shifts and the delayed impact of brand-building. The long-term awareness effect of CTV showed up clearly.
- Scenario planning. Our Budget Scenario Planner let the team simulate the revenue impact of increasing or reducing spend before decisions were locked in, rather than relying on instinct or blanket cuts.
The model attributed $400M+ in revenue across online and offline channels, with a blended ROAS of 8x across the full channel mix.
The team moved from cost per lead decisions to revenue-based decisions, gained a holistic online and offline view, and now plan budgets with predicted outcomes. Best of all, CTV was validated with a real ROAS figure the leadership team could see.
Marketing mix modeling example 3: B2C lead generation business measuring website and in-store revenue
B2C lead generation business: what the model found
Website and in-store revenue measured together, dated from first customer interaction, around 100 weeks of data
The marker shows the 50% line. The bar is drawn at that ceiling, so the real figure sits below it.
So what: Radio beat two digital channels that had much more budget, and paid search, on roughly double radio’s spend, returned less. That made the case for reallocating, and Instagram earned a small incremental test.
B2C lead generation businesses often struggle to measure the impact of marketing on both website and in-store revenue.
Analytics tools, ad platforms and the CRM each give a different view, and revenue is frequently duplicated across multi-touch journeys.
It is perhaps unsurprising that 37% of respondents say their biggest marketing challenge is generating high-quality leads, because without trustworthy measurement it is hard to know which spend is producing them.
This was the situation for one of our customers. Their budget was spread across paid search, paid social, display, radio and press, with several activation platforms running at the same time and a CRM capturing revenue downstream.
Each reporting tool told a slightly different story, so the team made cautious decisions. Not because they lacked ambition, but because nobody could say with confidence where performance was really coming from.
We started with a marketing mix model built on around 100 weeks of weekly inputs across every active channel, treating online and offline in exactly the same way. We looked at weekly spend, how often each channel was live and how revenue moved in response.
Rather than anchoring revenue to the date it was recorded, we used the date of first customer interaction.
For any business with a meaningful gap between enquiry and confirmed revenue, this keeps attribution close to the actual marketing event instead of letting reporting lags distort the picture.
Every channel returned a positive ROAS and most showed headroom for more investment. The more interesting findings came from placing all channels side by side for the first time.
- Radio outperformed its budget share, with a higher ROAS than two digital channels that received significantly more investment.
- Paid search was performing, but it received roughly double the budget of radio and returned a lower ROAS, which made a clear case for reallocation.
- Instagram showed an unusually high ROAS off a very small spend base. That is promising, though the sensible approach is to test incrementally before drawing firm conclusions.
The team also looked at marginal ROAS, which asks what the next pound invested in a channel would actually return. Standard ROAS is a rear-view mirror, whereas marginal ROAS shows saturation and is far more useful for planning. All channels showed some diminishing returns, which is expected, and headroom existed across the board. The Budget Scenario Planner then modelled budget shifts so the team could see likely outcomes before committing any spend.
The results included 9x ROAS on key offline channels and the finding that fewer than 50% of conversions were driven by paid media. Online and offline media were measured in a single model for the first time, ROAS was deduplicated across all channels, and internal teams and agencies aligned on one source of truth.
What these MMM examples have in common
The businesses in these examples were in different sectors, with different sales models and different channels. Yet the benefits we saw were remarkably similar.
They gained a baseline for what marketing contributes, evidence for upper-funnel and offline activity, a view of diminishing returns and a way to test budget changes before spending the money.
What all three gained
Different sectors, sales models and channels, with the same four benefits
The value of marketing mix modelling becomes much clearer when you see how real businesses use it.
If you want to explore your own marketing mix, book a demo of Ruler and we will show you how first-party data, attribution and marketing mix modelling can work together for your business.
Marketing mix modeling examples FAQs
A health brand selling across ecommerce, retail and TV used a marketing mix model covering two years of data to join online and offline sales. It found that 85% of its DRTV impact carried beyond the week the ad aired, and that TV contributed 8% of total modelled revenue.
Businesses use it to measure offline and upper-funnel channels such as TV, radio and CTV, to compare channels on the same methodology, to find diminishing returns and to plan budget scenarios before committing spend.
It uses historical spend and revenue data to measure how each channel contributes to sales, including retail partners such as Amazon and Walmart. It also shows how long advertising influence lasts, so you can see the effect of brand activity on later purchases.
It models weekly spend against revenue, ideally dated from the first customer interaction, so the effect of marketing is not distorted by the delay between enquiry and sale. It can also include offline channels like radio and press alongside digital.
The main benefits are a clearer view of each channel’s contribution, deduplicated ROAS across online and offline media, visibility of upper-funnel impact and the ability to forecast budget scenarios with evidence rather than assumptions.