
We speak to marketing and data leaders every week who are trying to answer one simple sounding question. What channels are actually driving revenue.
Sounds like a straightforward question, but it isn’t. Most customers don’t make big purchasing decisions in one sitting. They see an ad, do some research, come back a few times, read a review or two, and eventually convert in a way that leaves little trace for your attribution model to pick up on.
If you’re leaning on GA4 or platform dashboards to make budget calls, you’re probably working from an incomplete picture. In our experience, joining up data from different sources is one of the biggest hurdles marketing teams face.
In fact, 22% of respondents told us that joining up different data sources is a main challenge with their marketing analytics.
That’s the gap cross channel advertising software is built to close. In this guide we’ll cover what this type of software actually does, what we think is worth prioritising when you’re comparing platforms, and how nine of the leading tools stack up going into 2026.
What you’ll find:
- What is cross channel advertising software
- What to look out for cross channel advertising tools
- Our comparison of cross channel advertising software
Pro tip
If a mismatch between platform-reported conversions and actual sales sounds familiar, it’s worth seeing how first-party tracking, multi-touch attribution and probabilistic modelling can close that gap. Book a demo with Ruler Analytics to see it against your own data.
Our definition of cross channel advertising software
Cross channel advertising software is a category of tools that help marketing teams plan, manage, measure and optimise advertising spend across more than one channel, rather than looking at each platform in isolation.
That might mean Google, Meta, LinkedIn, TikTok, display, CTV, video and offline advertising all being pulled into one place so performance can be compared on a level footing.
The category covers a fair amount of ground. Some tools are built primarily for campaign management and bid optimisation across ad accounts, while some focus on pulling raw data together into a single warehouse or dashboard.
Others, us included, focus on measurement, working out which channels and touchpoints actually influenced a sale so budget can be allocated with more confidence.
The common thread is this. None of these platforms treat a channel as a silo. They’re designed around the idea that customers move between channels before they convert, and that decisions made on single-channel data alone tend to be flawed.
This matters more than it used to. 44% of the marketers we surveyed cite cross-channel journeys, both online and offline, as one of the main challenges with effective marketing attribution.
What we recommend looking for in cross channel advertising software
We’ve reviewed a fair few of these platforms over the years, and spoken to hundreds of customers about what’s worked and what hasn’t. A few things tend to separate the tools that earn their keep from the ones that end up abandoned after six months.
Coverage across the channels you actually use. This sounds obvious, but it catches people out. A tool that’s excellent for paid search and social won’t necessarily handle CTV, offline conversions, or a long B2B sales cycle particularly well. Map out your channel mix first and check the tool actually supports it, ideally with native integrations rather than a workaround.
A measurement approach that goes beyond last-click. Last-click attribution has a habit of crediting whichever channel happened to be there at the end, usually direct or branded search, while starving the channels that built awareness in the first place. Look for multi-touch attribution as standard, and ideally something that accounts for impression-based influence from channels like display or CTV too.
Deduplication and a single source of truth. When every ad platform reports its own conversions within its own attribution window, the numbers rarely add up to your actual sales. 28% mention siloed data as an obstacle to effective marketing attribution, and deduplication is usually the fix.
Offline and CRM connectivity. If a meaningful chunk of your revenue comes from phone enquiries, showroom visits or sales conversations, a tool that only tracks what happens on your website is only ever going to tell you part of the story.
Budget forecasting, not just historical reporting. The best platforms don’t just tell you what happened last month. They help you model what would happen if you shifted spend between channels, so decisions are based on predicted outcomes rather than a hunch. Our own budget scenario planner is one example of this in practice.
Pricing that matches how you’ll actually use it. Some tools price on ad spend managed, others on data volume, seats, or connectors. Get a clear read on what triggers a price increase before you commit, since a few of the tools in this list have a habit of creeping upwards as usage grows.
Pro tip: Want to see how your own budget allocation would shift under a data-driven model. Book a demo and we’ll walk through your data with you.
Cross channel advertising software reviewed for 2026
We’ve grouped together nine tools that marketing, data and RevOps teams commonly shortlist when comparing cross channel advertising software. Ruler Analytics is included, and in the interest of being upfront, it’s also the tool we build and sell. We’ve tried to describe it with the same structure and the same honesty as everything else on this list.
Ruler Analytics
What we’ve designed it to solve
Ruler was built around a problem we kept hearing from customers directly. Marketing teams could see plenty of activity across their channels, but couldn’t reliably connect that activity to actual revenue, particularly when a lead came in through a phone call, a form, or a live chat conversation rather than an online checkout. We designed Ruler to deduplicate conversions across channels and unify reporting into a single view, so a lead that touched paid social, organic search and email over several weeks isn’t counted three times or credited to the wrong place.
Ruler uses first-party JavaScript tracking to follow the full customer journey from first visit through to closed revenue, then layers statistical modelling on top through marketing mix modelling and data-driven attribution. That combination is deliberate. First-party tracking gives you the granular, click-level detail, while the modelling side accounts for the upper-funnel influence that never generates a click at all, things like CTV, display, podcasts or offline advertising. Together they’re designed to improve not just measurement, but forecasting and budget allocation too.
Ruler also pushes data back out as well as pulling it in. Revenue and offline conversion data can be sent back to your ad platforms, which in our experience helps improve bidding and audience optimisation because the platforms are optimising towards actual revenue signals rather than proxy metrics like form fills.
Where we see it work best
Businesses with longer or more complex sales cycles tend to get the most value, particularly those where a meaningful share of revenue comes through phone enquiries or sales conversations rather than a straightforward online transaction. It also tends to suit teams running a genuinely diverse channel mix, including offline and upper-funnel activity, who are tired of last-click attribution quietly underfunding the channels doing the early groundwork.
Consider Ruler if
You’re making budget decisions off platform-reported numbers that don’t add up to your actual sales, you have offline or CRM-based conversions that aren’t currently connected back to marketing, or you want to move from reactive reporting towards forward-looking budget scenario planning informed by marketing mix modelling.
Pricing
Ruler publishes indicative pricing on its pricing page, scaled by monthly traffic volume. Plans start from around £299 a month for up to 10k monthly visits, rising through £499 a month for up to 50k visits and £999 a month for up to 100k visits, up to £1,499 a month and above for higher-traffic accounts that need marketing mix modelling and AI agent features. Annual billing brings a 10% saving, and agency partner rates are also available. Exact cost still depends on the specific integrations and data requirements involved, so it’s worth booking a demo to get a number tailored to your setup.
Adobe Analytics
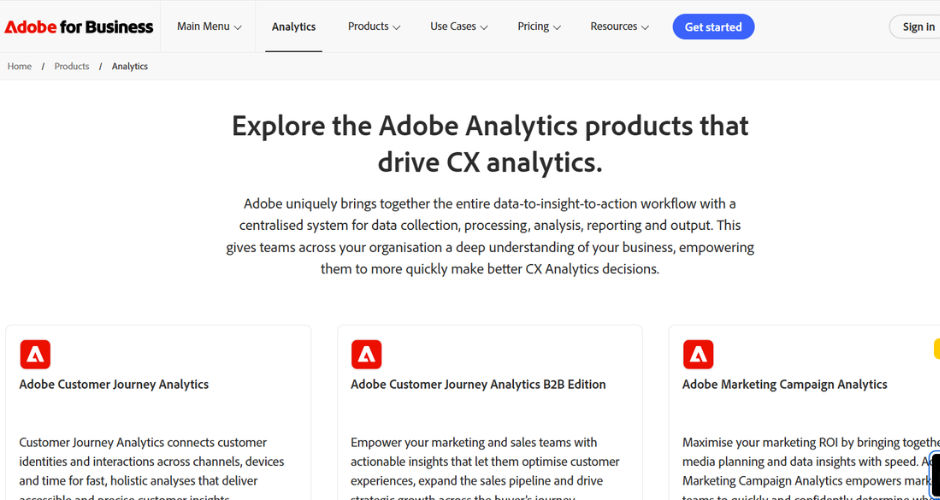
Adobe Analytics is part of Adobe’s Experience Cloud and is aimed squarely at large enterprises with complex digital estates.
Where the tool shines
Adobe Analytics is built for scale. It offers unsampled data, deep customisation, and centralised reporting across web and mobile properties, which makes it a strong fit for organisations with large, complex digital footprints and dedicated analytics teams to run it. Its Customer Journey Analytics module extends this further, letting teams aggregate behaviour up to an account level for B2B use cases.
Where it falls short
The complexity that makes Adobe powerful for enterprise teams is the same thing that makes it a poor fit for smaller ones. Implementation typically takes three to six months, considerably longer than lighter-weight alternatives, and it generally requires dedicated technical resource to configure and maintain. It’s also worth knowing that pricing depends on factors like monthly data volume, digital properties, required features, user seats and contract length, so costs can escalate as usage grows.
Pricing
Adobe doesn’t publish list prices. Prospective customers must contact Adobe sales via the pricing page to receive an individualised proposal, and industry estimates commonly put enterprise deployments well into six figures annually.
Funnel
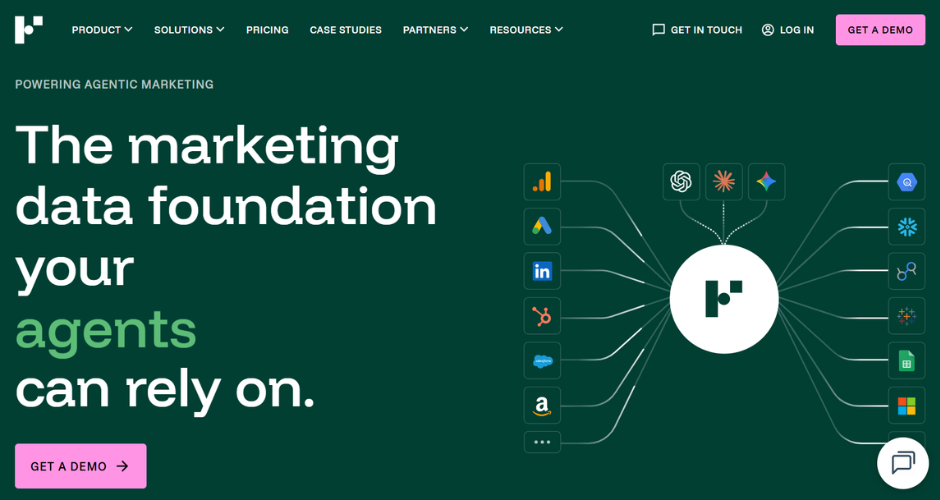
Funnel positions itself as the data layer between your marketing platforms and your BI tools, collecting and cleaning data rather than building the dashboards itself.
Where the tool shines
Funnel’s connector library is genuinely one of the broadest in the category, and it’s Funnel that maintains and updates those connectors as platform APIs change, which takes a fair bit of ongoing maintenance off your team’s plate. It’s purpose-built for marketing data, with a marketing-specific data model and transformations rather than a generic ETL approach, and teams commonly use it for centralised cross-channel dashboards and as the unified data source feeding marketing mix modelling or attribution elsewhere.
Where it falls short
Funnel moves and normalises data, but it doesn’t provide its own deep analytical interface for campaign optimisation, so most teams still need a separate BI or measurement tool to actually act on what it produces. Pricing has also shifted noticeably in the last year, moving away from a free tier towards an enterprise-first model, which has been a point of frustration for some existing customers.
Pricing
Funnel pricing is usage-based and tiered by connector volume and destinations, starting in the low hundreds of dollars per month for smaller plans, with enterprise pricing negotiated based on data source count and spend under management.
Google Analytics 4 (GA4)
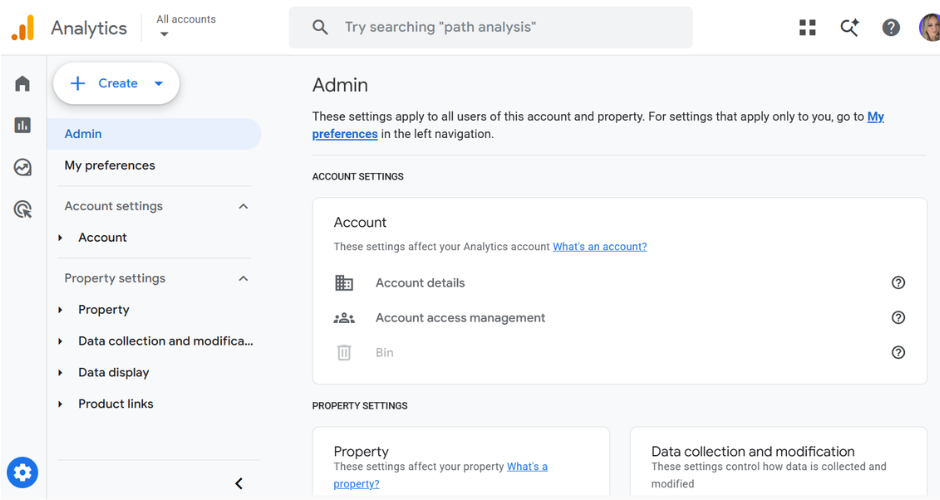
Google Analytics 4 is the free, near-default web analytics tool for most marketing teams, and is often the first stop before a business considers a dedicated cross channel platform.
Where the tool shines
It’s free, quick to set up, and covers the fundamentals of web and app analytics well for most small to mid-sized businesses. GA4’s data-driven attribution model, now the default, is a genuine step up from the old last-click default in Universal Analytics, and Google has continued to expand cross-channel conversion reporting within the platform through 2026.
Where it falls short
GA4 still may not support complex requirements such as multi-touch attribution across offline and online channels, and its attribution reports become unwieldy with more than around five channels, with custom channel groupings needing ongoing manual maintenance. Offline conversions, such as phone calls or in-person sales, generally need to be imported manually, and data-driven attribution needs a reasonable volume of conversions to be statistically reliable in the first place, which rules it out for smaller accounts.
Pricing
GA4’s standard version is free. Google Analytics 360, the enterprise tier, uses custom pricing based on volume and is typically negotiated directly with Google.
Haus
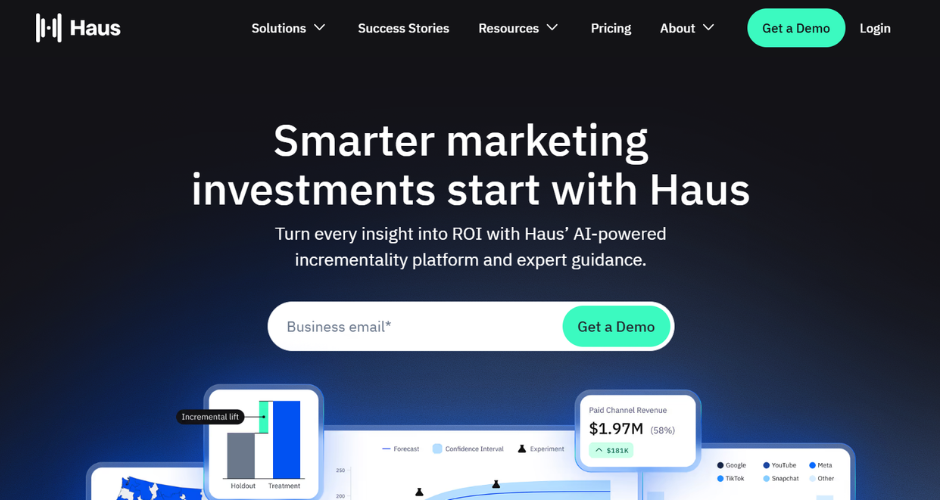
Haus is a marketing science platform focused specifically on incrementality testing, using geo-based experiments rather than click-based attribution.
Where the tool shines
Haus is built for statistical rigour. It uses automated incrementality experiments and offers products like GeoLift for geographic testing and Causal Attribution for regular incrementality assessment, letting teams design and execute experiments within minutes and receive results in as little as two weeks. Because it’s built around geo experiments rather than user-level tracking, it avoids pixels, cookies or personally identifiable information, which is a genuine advantage as privacy rules tighten.
Where it falls short
Haus measures what you choose to test, which is a different proposition to always-on, full-funnel measurement. As one review of the incrementality testing category puts it, tools like Haus can leave measurement gaps across the full mix and results generally need reconciling manually against other measurement tools, since it sits somewhat siloed from broader cross-channel reporting.
Pricing
Haus doesn’t publish pricing publicly. Industry estimates place similar incrementality platforms at custom enterprise pricing based on company size and testing volume, generally aimed at mid-market and enterprise brands.
Insider
Insider (now marketed as Insider One) is an omnichannel marketing and personalisation platform that orchestrates campaigns across web, mobile, email, SMS and other channels.

Where the tool shines
Insider’s core strength is orchestration rather than measurement. It supports over 12 channels and facilitates seamless omnichannel customer journeys, with a visual drag-and-drop workflow builder that lets marketers design complex customer journeys without deep technical skills. It’s also well regarded, having been named a 2026 Gartner Magic Quadrant Leader for Personalization Engines.
Where it falls short
Insider is built for personalised campaign delivery rather than cross-channel measurement or attribution, so it tends to sit alongside a separate analytics or attribution tool rather than replacing one. It’s also very much an enterprise product. Insider operates exclusively on annual contracts with custom pricing, and there are no self-serve plans, which puts it out of reach for smaller teams.
Pricing
Insider doesn’t publish pricing. It’s quote-based and sold on annual contracts, generally aimed at larger organisations with bigger marketing budgets.
Nielsen
Nielsen is a long-established measurement provider, best known for audience measurement and cross-media planning tools such as Nielsen Media Impact.

Where the tool shines
Nielsen’s differentiator is scale and independence. Nielsen Media Impact is used for cross-media reach and frequency planning, building scenarios across TV, streaming, CTV, digital and audio while accounting for duplicated audiences, drawing on Nielsen’s long-standing panel and audience data. For businesses with a heavy TV, streaming or offline media presence, that breadth of cross-media data is hard for smaller vendors to match.
Where it falls short
Nielsen’s tools are primarily planning and measurement instruments rather than an all-in-one cross-channel advertising platform. It’s primarily a planning and analytics tool for reach and frequency and scenario planning, and most teams use it alongside separate buying platforms such as DSPs or social ad managers. It’s also worth noting more broadly that only around 32% of marketers globally measure their media spend holistically across both digital and traditional channels, and fragmented tools like this are often part of the reason why.
Pricing
Nielsen’s enterprise products are quote-based, typically driven by the number of markets, modules, users and data access required. Pricing isn’t published and is negotiated directly with Nielsen.
Skai
Skai is an omnichannel advertising management platform covering paid search, paid social, retail media and app marketing from a single interface.
Where the tool shines
Skai’s strength is bringing walled garden advertising into one place. It centralises marketing spend and performance data across channels including paid search, paid social, retail media, apps, display and connected TV, and supports 80+ publishers globally with 50,000 live integrations. It’s also moved to flat annual pricing based on program scale, replacing unpredictable rates tied to media spend percentages, which several users see as more transparent than the old model.
Where it falls short
Skai is strong on activation and campaign management, but weaker as a measurement tool in its own right. One reviewer noted that because cross-channel views lean on platform-reported metrics, proving incrementality and reallocating spend with confidence still requires offline analysis. Coverage also isn’t uniform across every channel, with retail-media coverage feeling uneven, where data can lag and feature parity varies by retailer.
Pricing
Skai has moved to flat annual pricing tiers based on program scale rather than a percentage of media spend, with an Enhanced Enterprise Premier tier for advertisers spending more than $35 million per year. Exact pricing isn’t published and requires talking to Skai directly.
Supermetrics
Supermetrics is a data connector and ETL tool that pulls marketing data from a wide range of platforms into destinations like Sheets, Looker Studio, BigQuery or a data warehouse.

Where the tool shines
Supermetrics’ connector library is its headline feature. Supermetrics connects to over 100 marketing data sources, and its Connector Builder, launched in February 2026, lets teams create custom integrations for platforms that aren’t natively supported. For teams that already have a reporting or BI tool and just need reliable data piped into it, it does that job well.
Where it falls short
Supermetrics is a connectivity tool, not a measurement or attribution platform, so you’ll need something else to actually turn the data into cross-channel insight. Pricing is also a common frustration. It’s charged separately for each data source, and reviewers frequently describe the overall cost structure as high, especially for small businesses or those needing many connectors. As of 2026, Supermetrics only offers annual billing, with no month-to-month payment option.
Pricing
Plans start at around $29 to $37 per month for a single connector, with the more commonly used Core or Growth plans running from roughly $159 to $177 per month for a handful of data sources. Enterprise pricing is custom and quote-based.
Ready to see what your cross-channel data is really telling you?
Choosing between these tools usually comes down to one question. Are you trying to manage and activate campaigns across channels, or are you trying to understand which of those channels are actually driving revenue. Most of the platforms above are strong at one or the other. Very few genuinely do both.
If it’s the second question keeping you up at night, that’s exactly the gap we built Ruler to close. First-party tracking that follows the full journey, multi-touch attribution and marketing mix modelling working together, and revenue signals fed straight back to your ad platforms to improve bidding. 54% of businesses now use paid as a marketing channel, and getting genuine clarity on what that spend is returning matters more than ever.
Book a demo with Ruler and we’ll show you what your own cross-channel data looks like once it’s unified.