We compare Oribi vs Google Analytics as website analytics tools to see what each can do and which is best.
Measuring your marketing is important. But where a lot of marketers fall flat is when they use website analytics tools as marketing impact measurement tools.
The two are not the same.
Google Analytics is a fantastic website analytics tool. It can support highlighting marketing impact, but for those in B2B, it falls short.
So what are your options?
Oribi is a paid-for tool that a lot of marketers rave about when it comes to measuring their website performance.
In this blog, we’ll look at:
- What Oribi is
- What Google Analytics is
- Oribi vs Google Analytics
- What tool we think you should use
Let’s get started.
What is Oribi?
Oribi is a paid-for website tracking tool that supports marketers with web analytics. The goal of Oribi is to simplify complex data to make it easy to understand no matter what level of skill you have in data analytics.
Recently acquired by LinkedIn, Oribi aims to answer the questions every marketer struggles with.
Oribi highlights their key features as event data, funnels, channel analysis and visitor journeys.
We’ll look into the features they offer in more detail shortly.
What is Google Analytics?
Google Analytics is the best well-known website measurement tool for marketers. It provides a totally free version, as well as a paid-for version.
Most marketers use just the free version as it offers a huge range of features and reports to track the impact of your website.
From channel acquisition to conversion tracking, Google Analytics 4 is the leader when it comes to marketing measurement and analytics.
So, how does Oribi compare to Google Analytics?
Oribi vs Google Analytics
While on the surface Oribi and Google Analytics 4 are similar tools, they offer very different features and levels of reporting.
To best compare the two, we’re going to look into some key features and how they differ from tool to tool:
- user journey tracking
- funnel tracking
- level of reporting
User journey tracking: Oribi vs Google Analytics 4
Tracking user touchpoints is becoming more important to marketers. Being able to measure full customer journeys end to end can support you to find more valuable marketing touchpoints.
Oribi
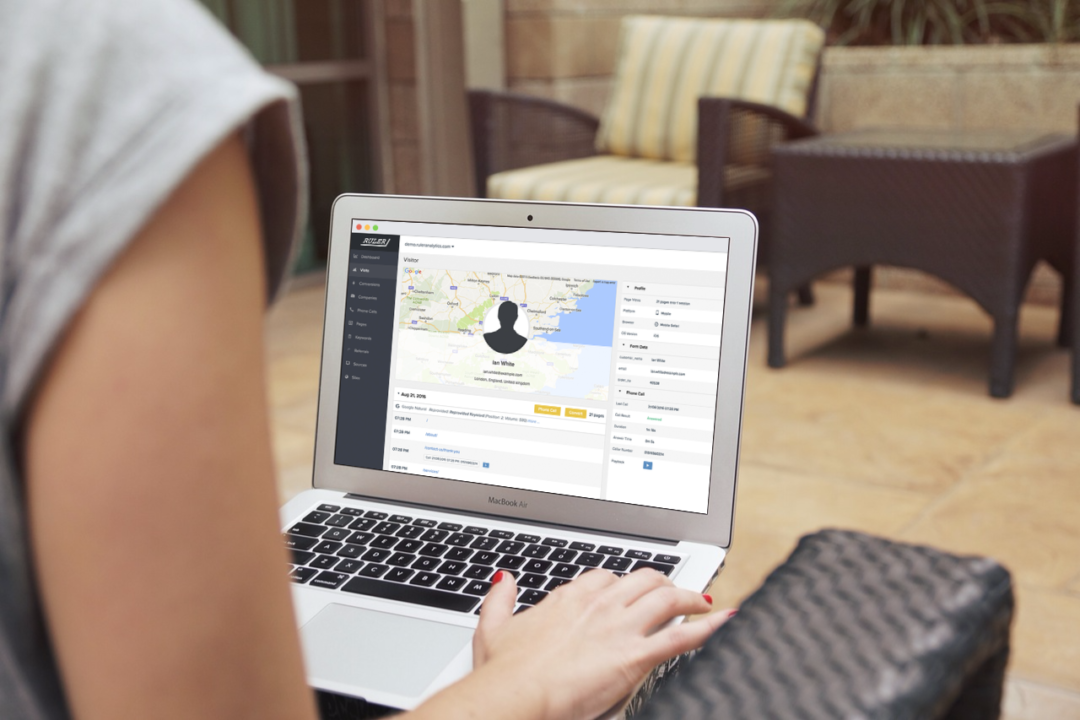
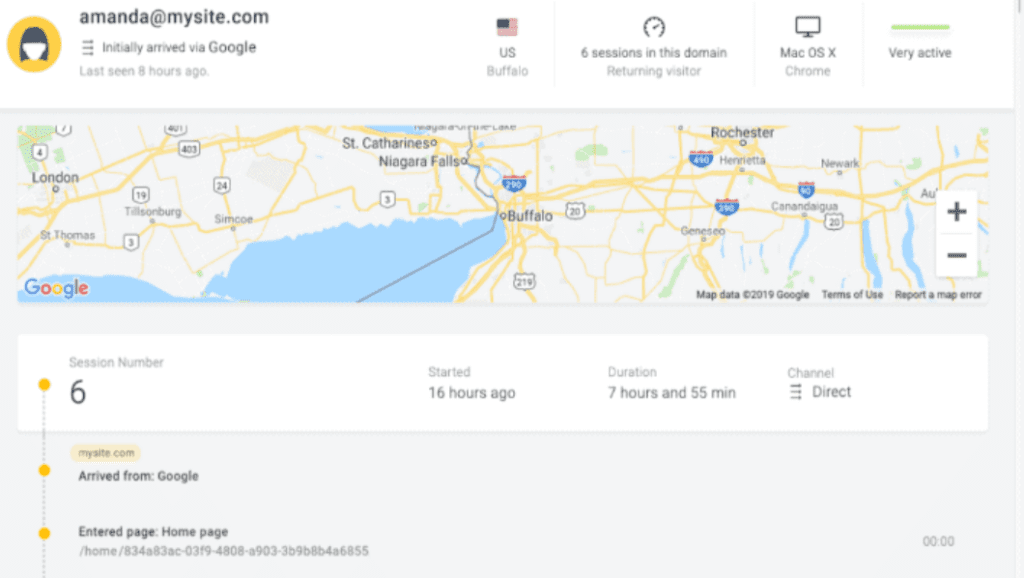
User journey tracking in Oribi is pretty robust. Oribi’s Visitor Journey report allows you to pinpoint every single step a user takes on their customer journey.
You’ll be able to see:
- the user’s email address
- their location
- how they first landed on your website and on which page
- the number of sessions
- session duration etc
This is a helpful report, especially for those high-value customers.
Using this view will allow you to see their full customer journey and use that insight to identify valuable touchpoints that could be more likely to trigger conversions.
Google Analytics
You can’t see a full customer journey in Google Analytics like Oribi. There is one main report you can use though to look at the content flow.
You could look at the path exploration report, which helps you visualise how users move through your website content.
Google Analytics is prohibited in its data due to privacy legalities.
It means it can’t show you any kind of visitor-level analytics, which is why you can’t view any of your reports for one individual user.
Instead, all of your metrics are merged by visitors, meaning you get quite a shallow view of your performance.
Related: How to track user journeys in Google Analytics
Funnel tracking: Oribi vs Google Analytics 4
A marketing funnel is a key tool that helps you find problem areas where users aren’t continuing their journey with you.
If you’re generating a lot of top-of-the-funnel actions, but they’re not moving down, then that needs to be addressed.
Having a view of your funnel is key to being able to make these key changes.
Oribi
Oribi offers a lot of excellent funnel-tracking features that can help you get a view of your entire funnel.
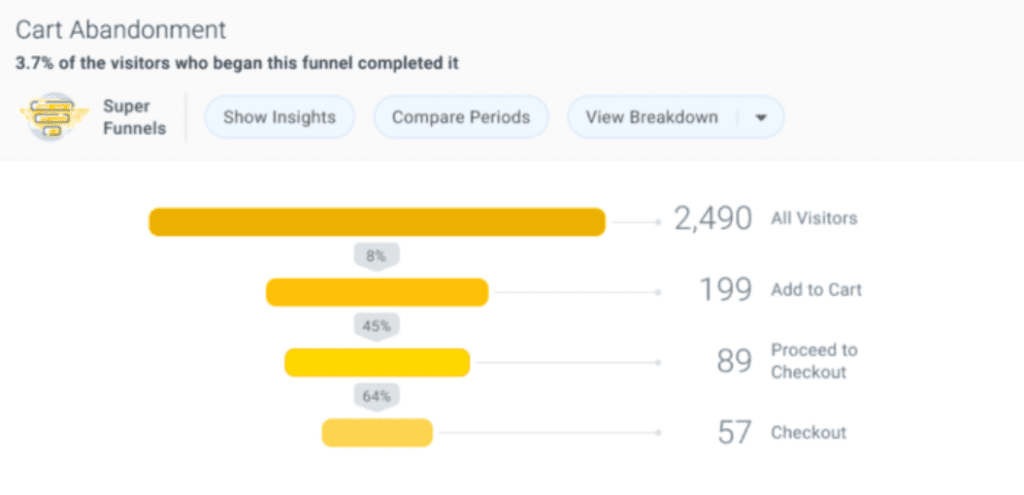
You can set up actions which Oribi will then track as part of your funnel. You can create anything as an action, even as small as a button click.
The cool thing about Oribi is that it offers a little sidebar of insights. It could show things like, Facebook users are X% less likely to complete the funnel, or that desktop users are X% more likely. This can provide some really valuable insights when it comes to optimising your funnel.
You can compare your filter based on a range of different values from source, campaign and more.
Google Analytics
Google Analytics 4 offers a funnel exploration view. Just head to Explore and then Funnel Exploration. You can define up to 10 steps within your funnel.
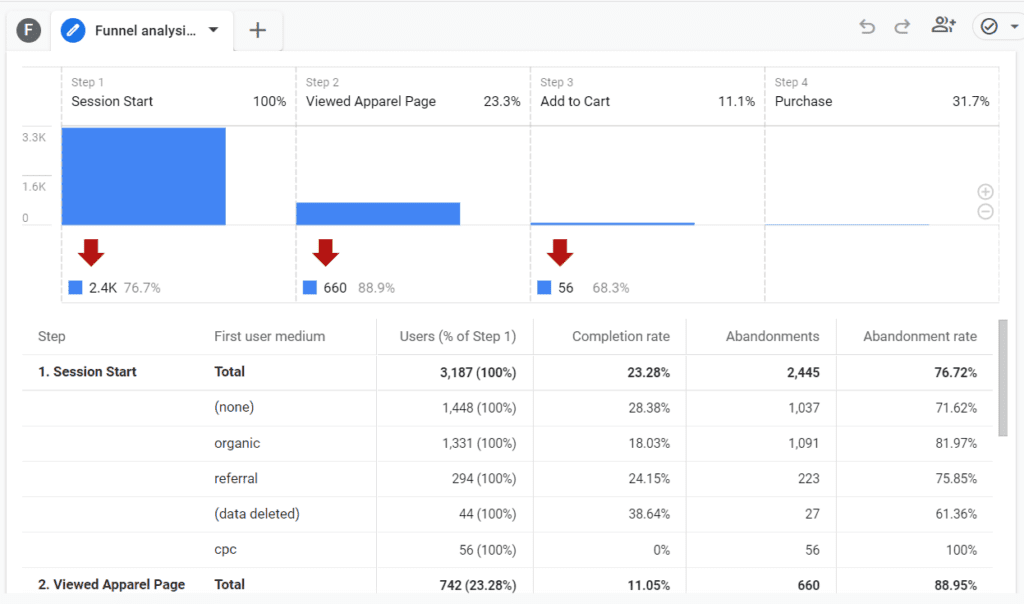
This works in a similar way to Oribi. Given both can track key actions on site, as well as revenue coming in if you drive sales online, it can be a really effective tool when it comes to mapping your funnel.
But you might be thinking, what about B2B marketers? While you can track key actions and lead conversions through funnel tracking, what about revenue?
There’s no point in optimising your funnel based on leads because what’s the guarantee of those leads converting? It’s another step in your funnel, meaning you need to be able to track the drop-off.
💡Pro Tip
Learn exactly how to track revenue as part of your marketing funnel. You can see exactly how you can link revenue back to your funnel and track the full picture.
Reporting: Oribi vs Google Analytics 4
There are endless ways to report on marketing success. The problem is finding what’s best to track as part of your regular reporting.
Google Analytics and Oribi both have a huge range of reporting tools and data but what’s the best?
Oribi works off of what they call ‘Magic Events’. It tracks page views and clicks automatically, but you can also create your own events to track other actions taken on your website.
Reporting with Oribi tends to revolve around these events. One report that is available in Oribi is being able to view your Magic Events by fields like:
- Session
- Channel
- UTM etc
You can also create reams of custom reports where you can pick and choose the metrics you wish to look at.
Google Analytics 4 meanwhile offers distinct reporting dashboards like Channel Acquisition, which you can then edit and apply filters to.
You can glean a lot of new information from reports we didn’t have previously. Be sure to look at the Explore section to view explorations like cohort exploration and user lifetime. These are deeper insight-led reports than the ones you would find under the Reports section.
Which is best? Oribi vs Google Analytics?
The good thing about Google Analytics is that it is free. Oribi is a paid-for product so you need to consider that before implementation.
Choosing the right tool for your marketing stack is totally personal. However, there are a few things to consider.
Do you need deeper insight into just your website analytics to justify paying for Oribi?
Are the features you’re looking for available elsewhere?
Well, we would say so.
While website analytics is one thing, you need to consider your website as one part of a whole. Without your website, your marketing efforts wouldn’t land. But equally, without your marketing efforts, your website wouldn’t land.
The same can be said when we look at reporting.
Your output is only as good as your data.
That’s why, for us, a deeper understanding of your marketing impact is required as opposed to a baseline view of your funnel or a user.
If you’re not using the data you’re getting, then it’s useless.
This is where we introduce Ruler Analytics. Similarly to Oribi and Google Analytics 4, Ruler can highlight the impact of your marketing.
However, where Ruler differs is that it uses revenue to prove its worth.
Related: How Ruler attributes revenue to your marketing
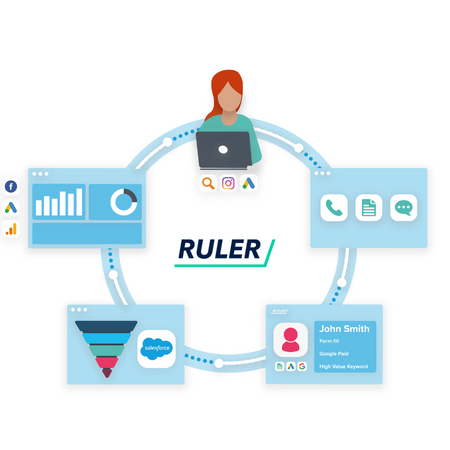
How Ruler Analytics works
Since Ruler is a marketing attribution tool, it works like this.
A user visits your website for the first time. Ruler’s code fires and it harvests the key lead data required. Ruler builds a customer journey, just like the one we saw in Oribi.
At the point of conversion, which is extra important for B2B marketers, Ruler fires all the data it holds over to your CRM. This allows you to better understand where your leads are coming from to understand your pipeline generation.
Then, at the point of sale, Ruler scrapes the revenue data inputted to that user in your CRM and fires it over to your website analytics tools; whether that’s Oribi or Google Analytics 4.
This is the important bit.
Ruler adds in revenue to these tools, meaning you can view your funnel data by revenue. It also means you can review the performance of your entire marketing strategy, all by revenue.
What are the benefits of integrating a tool like Ruler over the others?
- Automatic revenue data in your analytics tools
- Seamless attribution of revenue to marketing channels, campaigns, ads and keywords
- Full customer journey views to see what drives high-value customers
- Simple tracking of every conversion and touchpoint
Sound good? Book a demo to see Ruler in action and our team of experts will run you through how Ruler could be a better fit for you and your business.
Not sure on attribution? Read our complete guide to marketing attribution or check out our free courses on all you need to know when it comes to revenue attribution.