Login
Book a Demo

Compare your conversion rates with industry averages to see how you measure up. This data shows which channels are performing and which need attention, helping you spot where to focus in 2025 and beyond.
Knowing the average conversion rate by marketing source helps you see where you stand against the rest of the industry. It gives you a benchmark to measure the effectiveness of each channel, so you can see which sources deliver and which fall short.
With this insight, you can focus on the channels that work, fix those that don’t, and find new opportunities to bring in business.
Here’s what you’ll learn:
💡 Get the unified marketing measurement framework
Want a clear path to better marketing decisions? Our Unified Marketing Measurement ebook is a simple, practical guide to help you adapt. It’s built on proven best practices and tailored to your budget, activity type, and marketing maturity, whether you’re in B2B, B2C, lead gen, e-commerce, or retail. Learn how to unify first-party tracking, multi-touch attribution, marketing mix modelling, and incrementality testing into one approach that works.
Download the framework for unified measurement
In this study, we look at conversion trends, statistics, and averages across different industries to help you decide where to focus your time and budget.
For clarity, we define a conversion as a qualified lead. Someone who has shown interest in your product or service and has a higher chance of becoming a customer.
The data comes from Ruler Analytics, where we help marketers track customer journeys and attribute revenue across multiple touchpoints and channels using multi-touch attribution and marketing mix modelling.
Our users track both online and offline conversions to see exactly where leads come from and how each channel impacts pipeline and revenue.
To compile this study, we analysed Ruler’s global database of over 100 million data points to identify the average conversion rate across fourteen industries.
💡 Get a deeper look of Ruler
There’s more Ruler can do alongside its lead tracking and revenue attribution, and we’d love to show you. We have a complete guide on everything you can discover in Ruler. Or, for a more personal touch, book a demo, and we’ll give you a tour of all the good stuff.
See how Ruler tracks your leads and revenue
There’s no universal benchmark for a “good” conversion rate. It depends on factors like:
For example, low-cost items are often easier to sell because the risk is low. High-value purchases, on the other hand, usually take longer to convert and require more guidance before a decision is made.
Buying a discounted pair of shoes online is very different from purchasing a car or a house.
That’s why it’s essential to compare your results to industry-specific benchmarks, so you measure performance accurately, without overestimating or undervaluing your lead generation efforts.
By comparing your conversion rate against the industry, you’ll be able to spot opportunities and prioritise the marketing channels that have the propensity to drive higher qualified conversions.
Let’s kick things off and start with an overview of the average conversion, call and form rate across fourteen different industries.
The bar graph illustrates the average conversion rate by industry.
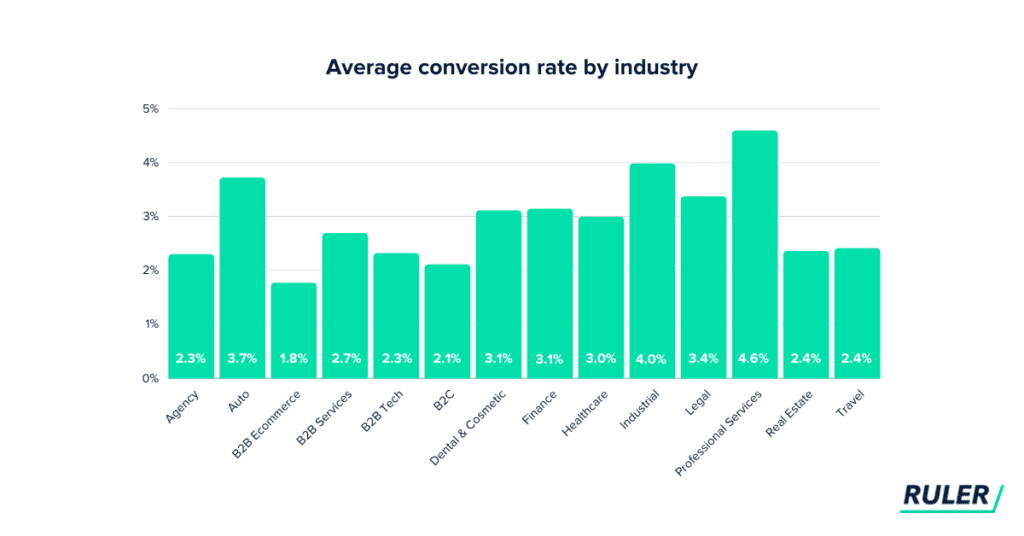
The average conversion rate across all fourteen industries is 2.9%.
Conversion rate varies across all industries.
One noticeable trend is that industries that sell higher-value products and services generally fall below the average conversion rate figure.
Buyers behave differently when making purchasing decisions that involve high ticket items.
As a result, the customer journey often becomes long and complicated.
Related: Guide to customer journey stages and how to track them
To use an example, a £49/month retainer in the professional services industry will have a higher conversion rate than a business trying to sell high-end properties worth considerably more.
People don’t buy high-cost items over the internet, as many factors need to be considered before making the final purchase.
But that doesn’t mean that online research doesn’t play a significant role in the customer journey.
The bar graph illustrates the average form rate by industry.
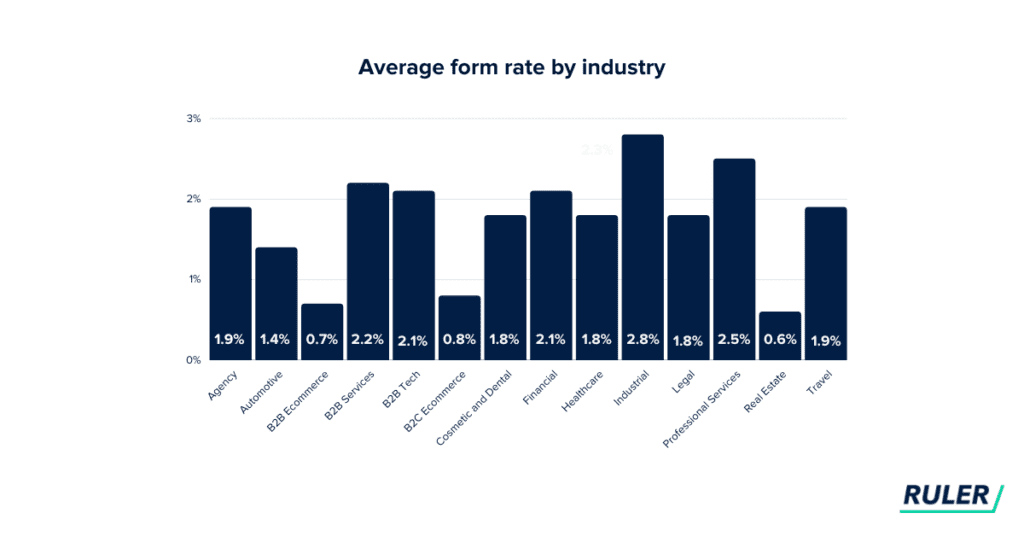
The average form rate across all fourteen industries is 1.7%.
According to this study, 67% of customers prefer self-service over speaking to a company representative.
Consumers desire more control of their buying journey, and web forms provide users with convenience as they can access any information they need without the added pressure of making a purchase.
Web forms also make it easier for customers to connect with brands whenever and wherever they might need.
For example, many service-based businesses in the B2B and professional industry operate during specific hours, which means that there’s not always someone there to pick up the phone.
With web forms, brands can continue to secure leads and collect contact information on prospective buyers outside of business working hours.
Let’s not forget that forms are a lot easier to track compared to phone calls and live chat enquiries.
Related: Three easy ways to track your form submissions
Using solutions like conversion tracking in Google Analytics, you can measure how many people visited your website, and of those individuals, how many filled out a form.
The bar graph below illustrates the average call rate by industry.
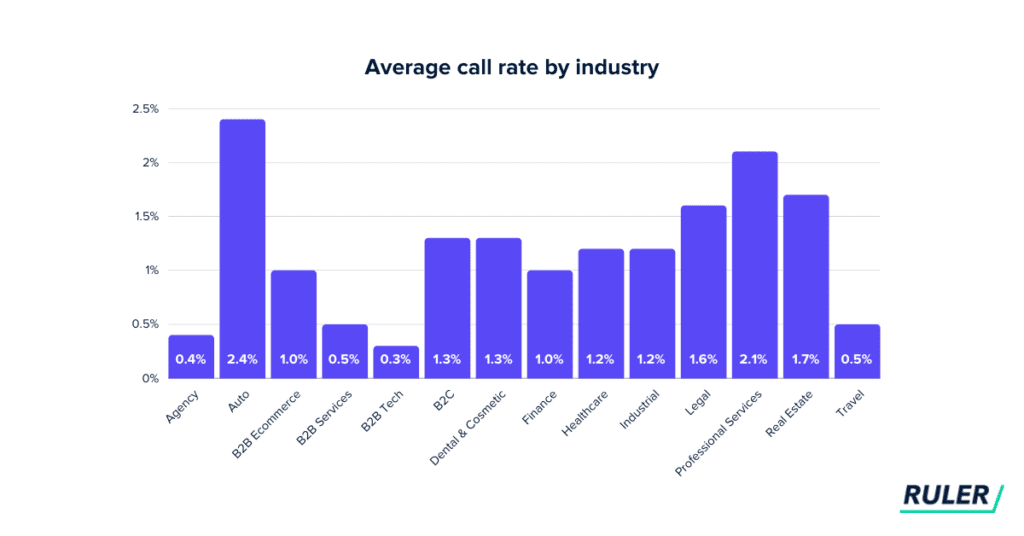
The average call rate across all fourteen industries is 1.2%.
Big-ticket buyers often require further details, or negotiations which can lead to lengthy, complex discussions.
A phone call allows buyers to talk about their requirements more confidently and get answers to questions that they wouldn’t get from a web form.
Also, people generally prefer to speak with a business directly when communicating sensitive information.
Let’s take the healthcare sector, for example.
Discussions between patients and healthcare services are often complicated as they usually involve the exchange of personal medical information.
With that being the case, phone calls are a better fit as they allow patients to discuss their health issues with complete ease and confidentiality.
Let’s take a deeper dive into the average conversion rate for each specific marketing source. For this study, we’ll be focusing on the following sources:
The bar graph below illustrates the average conversion, call and form rate for direct.
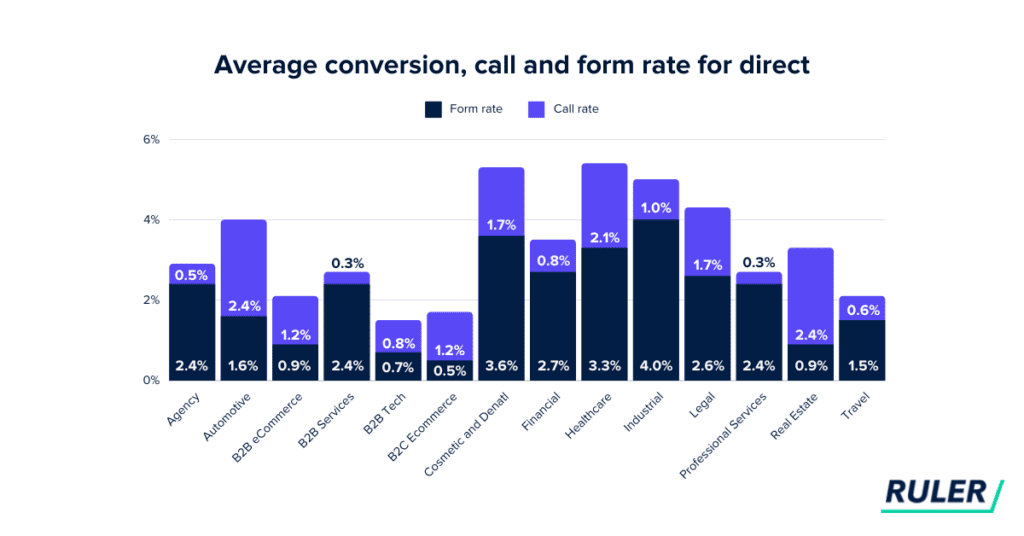
The average conversion rate across all fourteen industries is 3.3%.
We decided to include the source “direct” in our study.
That’s because direct traffic is a usual suspect in all traditional analytics tools. Across all the companies used in this study, the source “direct” made up 20% of overall traffic.
There’s good and bad when it comes to direct.
Direct can be an indication that people are visiting your site after seeing one of your social posts or ads on LinkedIn.
On the other hand, direct lacks source information, making it impossible for marketers to track the origin of the traffic and conversions.
Unfortunately for marketers, direct traffic is on the rise, and it’s becoming a problem.
The rollout of iOS 14.5 is partly to blame. The privacy features released in iOS 14.5 gave users the option to opt out of tracking for the purpose of targeted advertising.
This has had a significant impact on tools like Google Analytics, as it’s resulted in a decrease in the amount of data available for tracking and analysis.
The bad news is that direct traffic is unavoidable. Truth is, you’ll never be able to get rid of it.
The good news is that there are methods you can use to reduce direct traffic in Analytics. We have a complete guide on how to reduce direct traffic in Google Analytics, which can help you get started.
If you’ve already tried these methods and had no luck, you can always look into attribution and MMM tracking.
A marketing attribution tool like Ruler can help you look beyond the direct source by providing insights into the various touchpoints a customer interacts with before making a purchase or taking a specific action.
For example, let’s say a user sees an ad for your brand on Facebook.
They click the link, take a look around your website and leave. This user returns two days later after making a direct search and converts via a form fill.
If we were to use traditional analytics, this lead would likely end up as a direct conversion. But with an attribution, we can see what ad, campaign and keyword this lead first interacted with before converting into a lead.
💡 See Ruler in action
If you’re interested in learning more about our attribution tool and how it can benefit your marketing measurement, we’re here to help. We’ll walk you through the features of our tool and will do our best to any questions you may have.
Book a demo and see what Ruler can do for you
The bar graph below illustrates the average conversion, call and form rate for email.
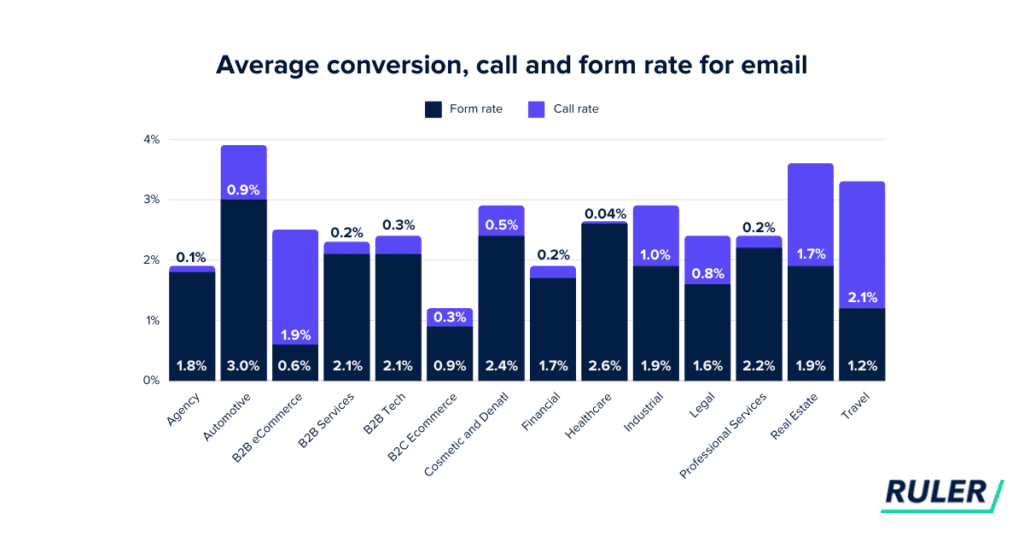
The average conversion rate across all fourteen industries is 2.6%.
Data reveals that automotive, real estate and travel come out on top for having the highest average conversion rates, whereas B2C services and agencies have the lowest rates.
The mass adoption of email makes it the perfect channel for marketers.
Despite the accelerated growth of modern communication channels, businesses continue to rely on email to converse and engage with leads and potential buyers.
A report produced by B2B Magazine found that 59% of B2B marketers believe email is their most effective channel for generating revenue.
B2B buyers have become more cautious, and the time it takes to convert a lead into a sale is getting longer.
For low-cost deals, a B2B sales cycle can take up to three months to close.
However, B2B sales cycles for higher value deals can fall between six to nine months.
Email is one of the most effective marketing channels for B2B lead generation, allowing companies to build relationships and credibility over a sustained period of time, using personalised messaging.
The bar graph below illustrates the average conversion, call and form rate for organic search.
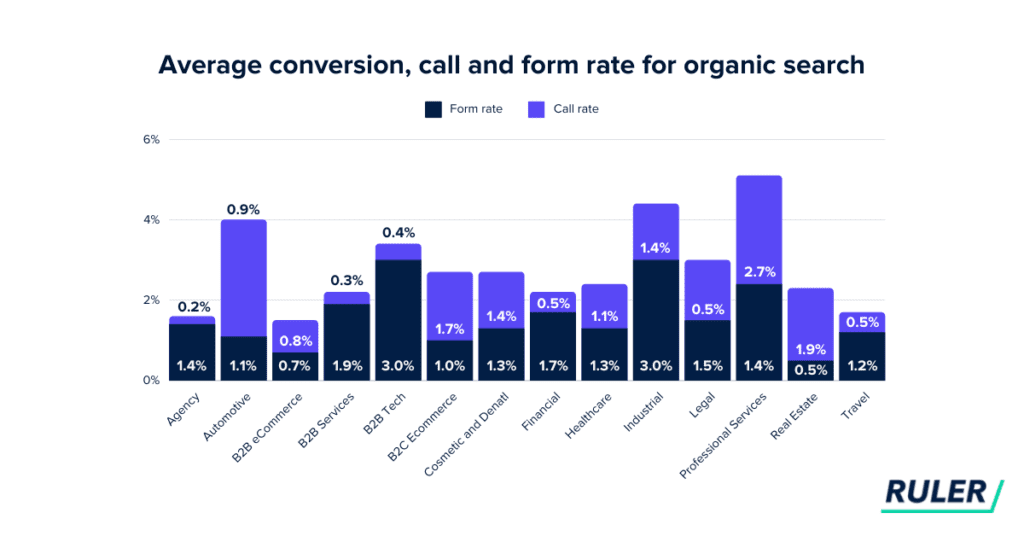
The average conversion rate across all fourteen industries is 2.7%.
Professional services and industrial sweep the board for having the highest conversion rates, whereas agency and B2B eCommerce fall to the bottom of the pack.
Overall, organic search is a significant driver of brand awareness, conversions and revenue for all businesses.
In fact, 49% of marketers believe organic search is the most profitable channel they use.
Interestingly, we found that businesses that provide services in the B2B space performed slightly better than those in B2C.
For B2B specifically, buyers want to ensure that the vendors they work with are genuine and will often turn to Google to perform research on specific products and services on behalf of their organisation.
Also, some search results in the B2B services aren’t yet considered highly competitive— unlike other industries we’ve used for this study.
For example, according to estimated data from Ahrefs, to rank on the first page of Google for the keyword “law firm”, you’d need backlinks from 681 websites.
For the keyword “hr services”, it’s estimated that you’d only need backlinks from only 108 websites for a better chance to rank in the top ten.
These are estimated figures, but there’s a significant difference between both keywords.
With that said, it’s worth keeping in mind that ranking factors play a huge role when it comes to measuring the performance of your conversion rate on organic search.
The bar graph below illustrates the average conversion, call and form rate for paid search.
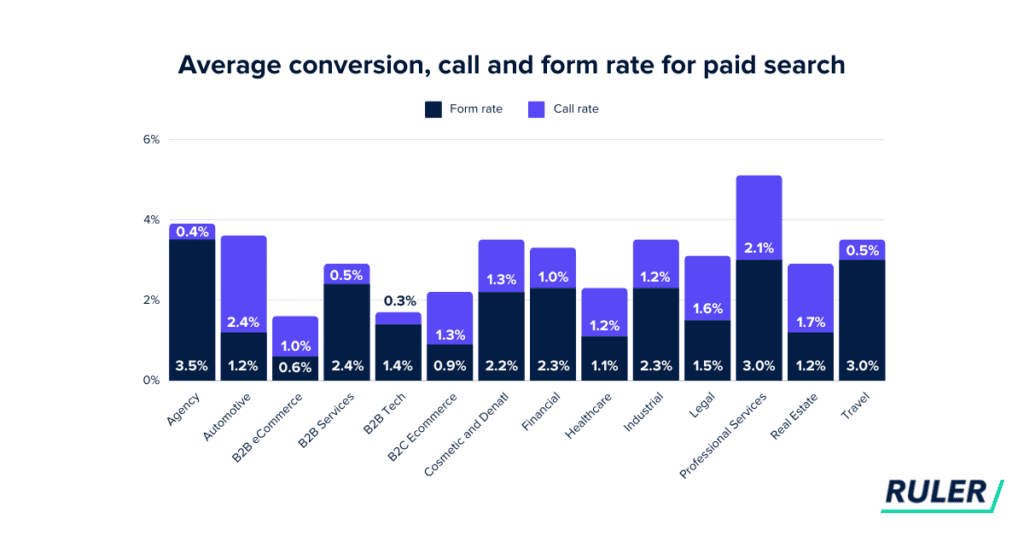
The conversion rate across all fourteen industries is 3.2%.
Professional services and finance came out on top for having the highest average conversion rate. B2B tech and B2B eCommerce delivered the lowest average conversion rates.
Paid search allows businesses to capture the interest of potential buyers who are ready to convert with keywords and ads that reflect their search intent.
Our data suggests that industries that deliver higher average sales generate lower conversion rates.
There are many risks involved when it concerns high-cost sales.
Buyers are a lot more cautious with investments and prefer to speak directly to a representative to ensure that they’re making the appropriate purchasing decisions.
Higher value buyers will often begin their journey online and will go on to close into a deal over the phone or in-store.
As a result, marketers with long sales cycles for high-value products are losing track of their end-to-end journey and find it extremely difficult to measure exact conversion rates.
Related: What is end-to-end marketing and how can you use it
If you’re struggling to streamline your online and offline customer journey, we may have the answer to your problem. We’ll get to this shortly, so make sure to keep reading.
The bar graph below illustrates the average conversion, call and form rate for referral.
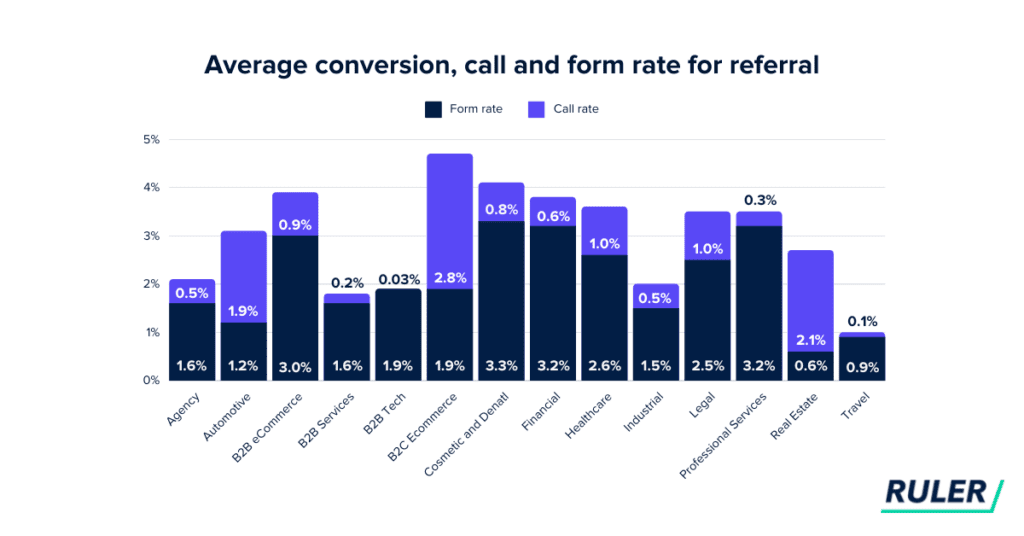
The average conversion rate across all fourteen industries is 2.9%.
Interestingly, B2B eCommerce had the highest average conversion rate, closely followed by dental. And travel delivered the lowest average conversion rate.
Review sites are the most trusted source of information on the web and often lead to positive buying outcomes.
In fact, 92% of B2B buyers are more likely to purchase after reading a trusted review.
Word of mouth and referral helps drive customer acquisition and growth in the healthcare sector.
Related: 5 easy ways to reduce your customer acquisition costs
When searching for dental or cosmetic surgeries, people want to feel assured that they’re putting their well-being in the right hands, and reviews are the perfect way to ensure this.
Despite driving the lowest conversion rates, referral sites often play a significant role in the buyer’s journey for businesses in the travel sector.
Many buyers will begin their customer journey online and seek out reviews on the web to help with buying decisions.
In most cases, a recommendation, either online or offline, can result in a brand search or direct enquiry.
The bar graph below illustrates the average conversion, call and form rate for social media.
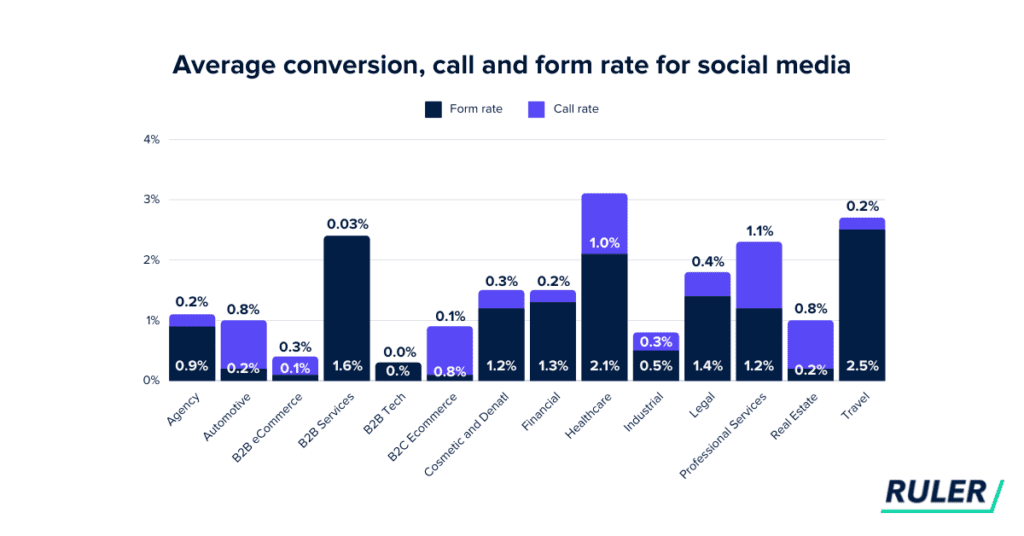
The average conversion rate across all fourteen industries is 1.5%.
Don’t let these low conversion rates set the alarm bells ringing.
Social media has always been a blessing and a curse for marketers.
Advertising on social media has allowed marketers to reach a much wider and more targeted audience and has played a key role in driving more impressions, leads and sales.
But with the good comes some bad.
Since the roll out of iOS 14.5, advertisers have struggled to prove social media’s impact on conversion and revenue.
The data backs it up. 40% of CMOs are struggling to measure the impact of social media on their business.
All major advertising platforms have rolled updates aligned with the privacy changes to improve data and reporting accuracy, but Meta has been the most proactive about it to date.
Meta launched the Conversions API (CAPI) in 2020. And in 2021, Meta updated it to enable tracking of any event directly on Facebook’s servers.
While Facebook’s conversion API has quickly become a promising alternative, it’s not perfect.
There are a few things you can do to get a more accurate view of your conversions and marketing performance in this privacy-first world. These include:
For example, our DDA + impression model incorporates insights from marketing mix modelling to assign fair credit to upper-funnel channels.
MMM-derived weightings are applied to the DDA data, shifting some attribution away from lower-funnel activities (like direct or brand search) towards channels that create initial awareness.
This method allows marketers to:
You can read more on Ruler’s attribution tracking here.
We hope these stats have inspired you to try new ways to boost your conversions and revenue.
Don’t forget. Using a marketing attribution tool like Ruler, you can unlock more powerful data and evidence the effectiveness of your marketing campaigns more accurately.
Don’t take our word for it. See how Totalmobile used Ruler to increase ROAS by 23%. Or book a demo with one of our experts and take your attribution reporting to the next level.