
Many PPC teams aren’t lacking data from Google Ads, they’re lacking a clear picture of what’s driving results.
Between the native Google Ads interface, a couple of dashboards, a spreadsheet someone built two years ago and a CRM that lives in its own world, it is entirely possible to be drowning in metrics while still struggling to answer a simple question from leadership, such as which campaigns are actually driving revenue.
In fact, research shows that 26% of marketers now use four or more tools just to track PPC performance, which says a lot about how fragmented this space has become.
We want to walk through what Google Ads reporting software actually needs to do, the different jobs it performs, and how to think about building a stack that suits your business, your sales cycle and your team, rather than simply bolting on more dashboards.
We discuss:
- What is Google Ads reporting software
- Different types of Google Ads reporting
- What we recommend to look for in Google Ads reporting tools
- Our recommendations for Google Ads reporting software
Pro Tip
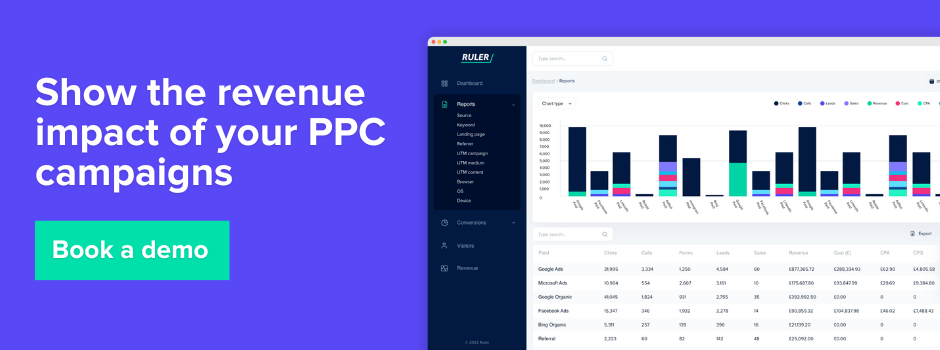
If you are already finding that Google Ads reporting tells you what happened in the platform but not what happened after the click, it might be worth seeing how Ruler connects that gap. Book a demo with Ruler and we will show you how it works with your own data.
How we define Google Ads reporting software
Google Ads reporting software is any tool that helps marketers collect, organise, visualise, automate or analyse data generated by Google Ads campaigns. That is a wide definition on purpose, because the category is wide.
It includes the built-in reporting inside Google Ads itself, dashboard and visualisation tools that sit on top of it, data integration platforms that blend Google Ads with other sources, and measurement or attribution platforms that connect advertising activity with what happens afterwards, such as leads, pipeline and revenue.
Given that 39% of marketers say they use Google for advertising, it is not surprising that so many tools have grown up around Google Ads specifically.
Native Google Ads reporting is genuinely capable. It shows impressions, clicks, cost, conversions, Quality Score, auction insights and a good deal more.
The limitation isn’t the depth of data within the platform, it’s that Google Ads can only report on what it can see: activity that happens within its own walls.
Natively, it can’t tell you what a lead was worth once it reached your CRM, whether a display impression contributed to a sale three months later, or how a client’s paid search campaign compares with their social spend without you exporting and combining that data yourself.
That is why most PPC managers, agencies and marketing teams end up supplementing native reporting with at least one other tool, and often several.
The different jobs Google Ads reporting software needs to perform
It helps to think about Google Ads reporting not as one job but as several distinct jobs, some of which overlap. In our experience working with performance marketing teams, the jobs generally fall into a few groups.
| Job | What it covers |
| Collecting and organising campaign data | The foundational layer: in-platform metrics like spend, clicks, impressions, conversions and Quality Score. Most teams start here and only look further once they need to combine this data with something else or present it externally. |
| Visualising and automating reporting | Turning raw numbers into something readable at a glance, without rebuilding a spreadsheet every week. Covers Google Ads dashboards and automated reporting tools for marketing managers, clients or finance. |
| Serving agencies and multiple accounts | Reporting consistently across many Google Ads accounts without manually rebuilding each one. Covers agency/client reporting tools and cross-account reporting features. |
| Bringing channels together | Consolidating Google Ads alongside paid social, organic search, email and other channels, so marketers aren’t interpreting five platforms side by side and doing the maths manually. Covers cross-channel advertising reporting and marketing data integration. |
| Understanding conversions properly | Connecting in-platform conversions to what happens next, especially for businesses where the sale closes on a call or in a pipeline rather than a form fill. Covers CRM and offline conversion reporting. |
| Measuring commercial impact | Connecting advertising activity to leads, pipeline and closed revenue, not just conversion volume. Covers marketing attribution, revenue measurement and customer journey tracking. Notably, 28.0% of marketers cite tracking and data privacy changes as a top challenge in measuring PPC ROI. |
| Accounting for upper-funnel and offline influence | Capturing influence that doesn’t produce a click, display, video, CTV and offline channels shaping demand before a branded search happens. Covers impression/upper-funnel measurement, marketing mix modelling and wider marketing intelligence. |
| Planning budget and scenario testing | Deciding where the next pound of spend will have the greatest impact, rather than relying on gut feel or last month’s numbers. Covers budget planning and scenario modelling tools. |
| Bringing it all into BI environments | Placing Google Ads data inside a broader BI, data warehouse or reporting environment alongside finance, product or operational data, rather than as a standalone marketing report. |
The right stack depends on your business model, sales cycle, team size, number of advertising accounts, conversion volume and how mature your marketing measurement already is.
For example, B2B SaaS company with a long sales cycle, multiple stakeholders and a mix of paid and offline marketing is likely to need conversion tracking, attribution and probably some form of budget planning as well.
What we recommend looking for when building a Google Ads reporting stack
Rather than starting with a list of tools, we would suggest starting with a list of questions.
- Do you need to report within Google Ads only, or alongside other channels?
- Are you managing one account or many, and do you need agency-style client reporting?
- How much of your conversion activity happens through forms, and how much through calls, live chat or offline sales conversations?
- Do you need to prove leads, or do you need to prove revenue?
- Is any meaningful part of your marketing activity upper-funnel or offline, such as CTV, display, events or brand campaigns?
- Do you need to plan and justify budget changes before you make them, rather than only reviewing performance after the fact?
- Does your reporting need to live inside a wider BI or data environment used by other teams?
Answering these honestly usually narrows the field quickly. It also avoids one of the more common patterns we see, where a team accumulates dashboards, spreadsheets and point solutions over time without ever building a connected measurement framework, so several tools all report slightly different numbers and nobody fully trusts any of them.
Google Ads reporting software reviewed for 2027
Instead of treating software as one long, undifferentiated list, it is more useful to group tools by the type of lead tracking they are designed for, since prospecting and revenue attribution address fundamentally different questions.
Ruler Analytics
From what we’ve seen in conversations with PPC teams, the frustration usually isn’t a lack of dashboards, it’s that those dashboards only show clicks and platform-reported conversions, not whether a campaign actually contributed to business outcomes such as revenue.
Ruler uses first party tracking to connect calls, form fills, live chat and other touchpoints to CRM and revenue systems, so Google Ads gets measured against closed revenue rather than conversion volume. Multi touch attribution lets teams compare models side by side, and conversion deduplication stops the same sale getting double counted across Google, Meta and LinkedIn, giving a more honest revenue baseline to report from.
It also goes further upstream than most attribution tools. Click based measurement can’t see activity like CTV, display or offline media that influences a decision without ever producing a click, so Ruler layers in marketing mix modelling to estimate that upper funnel contribution.
That modelling feeds Ruler’s budget scenario planner, which uses diminishing returns curves to show where extra spend will do the most, moving budget conversations closer to modelled allocation than gut feel. Ruler also feeds offline conversion signals back into ad platforms to help bidding, and brings marketing data into BI environments so Google Ads can be analysed alongside the rest of the business.
The result is a platform that doesn’t lean on one measurement method, combining first party tracking, MTA, MMM and budget planning in one place.
Where we see it work best
Based on the accounts we’ve worked with, Ruler tends to earn its keep with businesses running longer sales cycles, where the gap between a Google Ads click and a closed deal can stretch across weeks or months and several touchpoints. It also suits teams managing a meaningful budget across both digital and offline channels, since the combination of MTA and MMM is far more useful once there’s enough spend and enough channel complexity to justify it.
Consider Ruler if
You’re making Google Ads budget decisions based on lead volume or platform reported conversions rather than actual revenue, your sales cycle involves phone calls or offline touchpoints that get lost the moment a customer goes offline, or you’ve outgrown last click attribution and want a blended view that includes both click based and upper funnel measurement.
Pricing
Ruler’s pricing is published openly and scales by monthly unique visitors, with separate tiers depending on whether you need multi touch attribution, marketing mix modelling, or both. Multi touch attribution starts from £269 a month for up to 10,000 monthly visitors, rising to £499 for up to 50,000. Once you move into higher traffic bands (50,000 visitors and above), marketing mix modelling becomes available either on its own or bundled with MTA, with combined MTA and MMM plans running from around £1,499 to £4,999 a month depending on volume. A 10% discount is available for annual billing, and pricing for sites over 5 million monthly visitors is bespoke. Call tracking charges, including phone number setup and call minutes, are billed separately from the core licence.
Agency Analytics
Where the tool shines
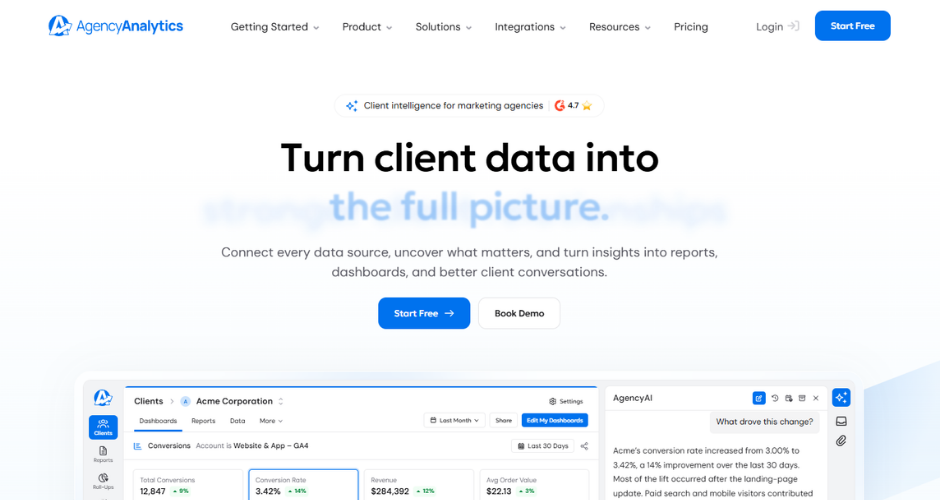
AgencyAnalytics is built specifically for agencies managing client reporting at scale, and it shows. With over 80 native integrations including Google Ads, Meta, LinkedIn and Google Analytics, it handles the practical side of agency reporting well, white label dashboards, a client portal that hides the AgencyAnalytics brand entirely, and a drag and drop editor built on top of hundreds of dashboard templates.
Its PPC markup tool is a nice touch for agencies that add a management fee on top of ad spend, letting you apply a single account wide markup or set custom rates per client. It also goes beyond pure PPC reporting into SEO rank tracking and backlink monitoring, which suits agencies covering more than just paid media for their clients.
Where it falls short
The pricing scales with the number of client campaigns rather than data volume, so it can get expensive quickly for agencies managing a large roster of smaller accounts. It’s also built primarily as a reporting and dashboarding layer rather than an attribution tool, so if you need to understand how Google Ads spend connects to actual revenue rather than platform metrics, you’ll be looking elsewhere.
Pricing
Plans start at $79 a month for the Freelancer tier (5 staff users, unlimited reports), rising to $229 a month for Agency and $439 a month for Agency Pro, which adds benchmarking, trend forecasting and anomaly detection. Enterprise pricing is available on request. Annual billing includes a discount.
Claude + Spreadsheets

Where the tool shines
This one works a little differently to the rest of the list, since it’s not a dedicated reporting platform so much as a flexible way of building your own. Claude for Excel is an add-in that brings Claude directly into your spreadsheet workflow, and for Google Ads reporting it’s genuinely useful when your needs don’t fit neatly into a template. You can ask it questions about a workbook and get answers with cell level citations, have it build or fill out a reporting model from scratch, debug a broken formula, or update assumptions while it preserves the underlying formula dependencies. It also supports connectors, so you can pull context from other tools straight into the sheet without leaving Excel. For teams who already live in spreadsheets for Google Ads reporting and just want the manual, repetitive parts taken off their plate, without paying for a full reporting platform, it’s a genuinely different way of approaching the problem.
Where it falls short
It isn’t a substitute for a purpose built dashboard or attribution platform. There’s no native Google Ads connector pulling data in automatically, so you’re still responsible for getting the data into the spreadsheet in the first place, and it works with the workbook you have open rather than a live, always on dashboard. It suits teams who want a smarter way to work within spreadsheets they already maintain, rather than teams looking to replace their reporting stack entirely.
Pricing
Claude for Excel is included with Claude Pro, Max, Team and Enterprise plans, so there’s no separate charge on top of your existing Claude subscription.
DashThis
Where the tool shines
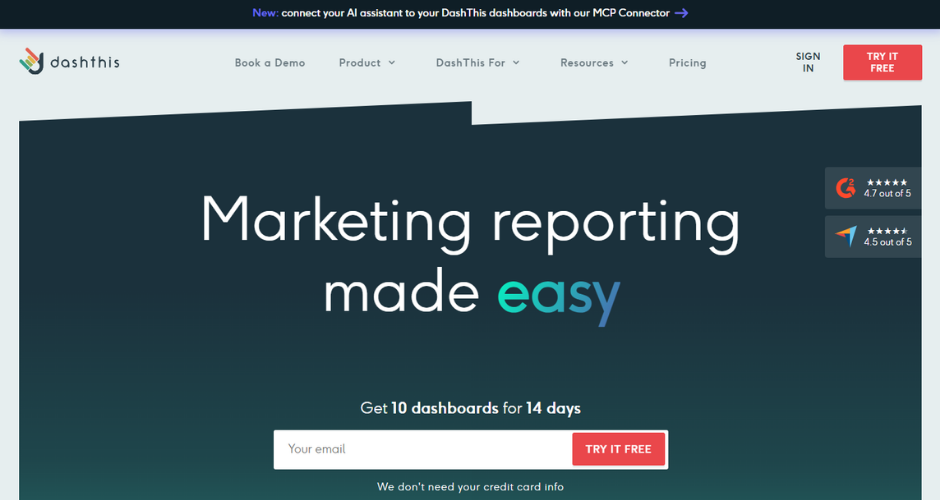
DashThis is one of the simpler tools on this list to get up and running, and that simplicity is really the point. It’s built around pre-made templates and a straightforward dashboard builder, so agencies and in-house teams can pull together a Google Ads report without much of a learning curve. Automated email dispatch, custom branding and dashboard commenting are all included from the entry tier, which is more generous than some competitors that gate branding behind a higher plan.
Where it falls short
Pricing is structured around the number of dashboards rather than data sources, and since most agencies build one dashboard per client, growth means upgrading tiers fairly regularly. It’s also a visualisation layer rather than an attribution or measurement tool, so if the question you’re trying to answer is “did this campaign actually make us money”, DashThis won’t get you there on its own.
Pricing
Plans start at $49 a month for the Individual tier (3 dashboards), rising to $149 for Professional (10 dashboards), $289 for Business (25 dashboards) and $449 for the Standard tier at higher volumes. A 15-day free trial is available, and annual billing brings the entry price down slightly. Note that DashThis updated its plan structure in early 2026, so it’s worth checking current tier limits before committing.
Databox
Where the tool shines
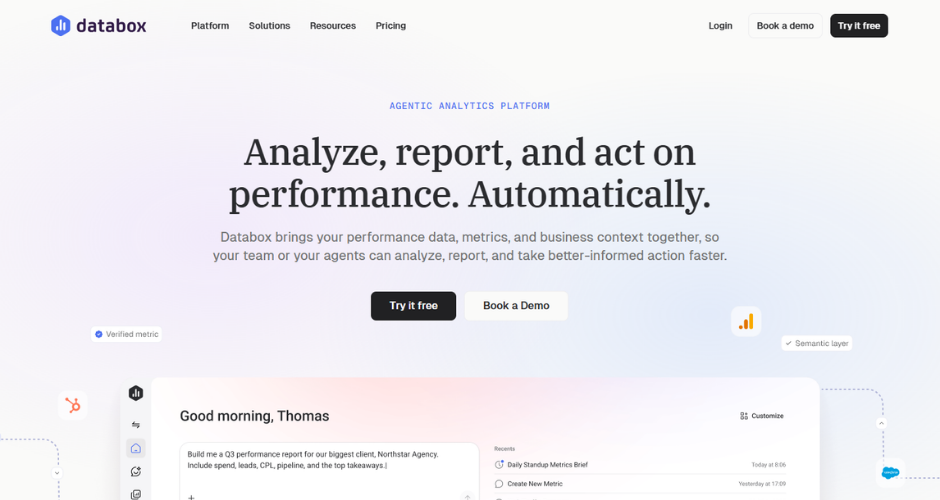
Databox goes further than a pure dashboard tool. Alongside the usual widgets and templates, it includes goal and OKR tracking, AI generated performance summaries, and benchmarking against industry data, which makes it more of a full business intelligence platform than a straightforward Google Ads report builder. With well over 100 native integrations, it’s a reasonable option for teams that want Google Ads sitting alongside CRM, finance and product data in one place, rather than viewed in isolation.
Where it falls short
Databox no longer offers an unlimited free plan for new sign-ups, and pricing is based on the number of connected data sources rather than users, which means costs can climb faster than expected once you’re reporting on more than a handful of clients or channels. Several of the more useful features, like AI summaries and forecasting, sit behind the higher tiers rather than the entry plan.
Pricing
Paid plans start from roughly $159 to $199 a month depending on billing frequency, covering a limited number of data sources, with Growth and Premium tiers running from around $399 up to $999 a month for larger teams needing more sources, forecasting and white labelling. A free trial is available in place of the old permanent free tier.
Data Studio
Where the tool shines
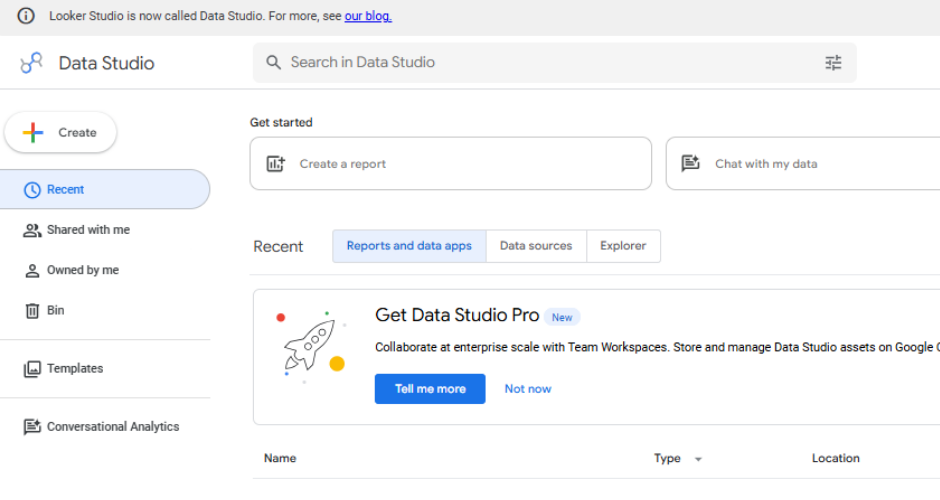
Data Studio is free, and for teams already living in the Google ecosystem, that’s a genuinely hard combination to beat. Native connectors for Google Ads, GA4, BigQuery, Search Console and Sheets all come at no extra cost, and the dashboards themselves are interactive, shareable and easy to embed without recipients needing their own Google account. For a lot of smaller PPC teams reporting mainly on Google’s own platforms, it’s simply the obvious first choice.
Where it falls short
The moment your reporting needs step outside Google’s own products, the free tier advantage starts to diminsh. Third party connectors for platforms like Meta or TikTok are often built and maintained by external vendors, and those can run anywhere from around $20 to $350 a month per connector, which adds up fast across a handful of channels. It’s also a general purpose BI tool rather than one built specifically for marketing, so there’s more setup and troubleshooting involved than with a purpose built reporting platform.
Pricing
Data Studio itself is free with unlimited reports and dashboards. Looker Studio Pro adds team workspaces, enterprise admin controls and SLA backed support for $9 per user per project per month. Third party data connectors are priced separately by their individual vendors.
Funnel.io
Where the tool shines
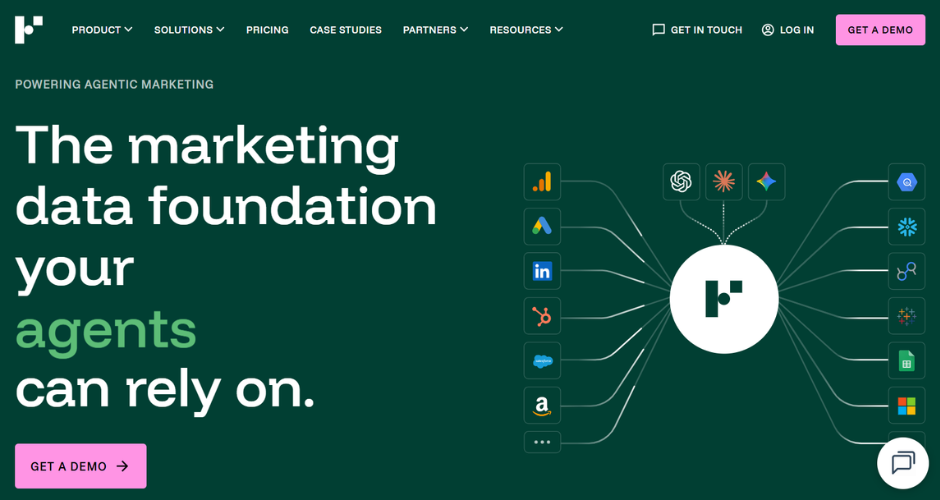
Funnel.io has built one of the deepest connector libraries in this space, covering well over 500 marketing and advertising platforms, which makes it a strong option for teams with a genuinely complex data stack that goes beyond the usual Google, Meta and LinkedIn combination. Its Data Hub is built for serious data transformation and modelling before that data ever reaches a destination like Looker Studio or BigQuery, and its data activation features can push conversion signals back out to ad platforms.
Where it falls short
Funnel.io’s pricing has changed more than once in the last year, moving away from its old freemium model and closing the free plan to new sign-ups. It now runs on a Flexpoints credit system, where every connector, destination and refresh cycle draws down a shared pool of credits, and a fairly modest setup can use up most of an entry plan’s allowance quickly. Several reviewers have flagged this as unpredictable to budget for compared with flatter, connector based pricing elsewhere.
Pricing
The Starter plan has moved around recently, having launched at $400 a month before being revised down, so expect somewhere in the region of $200 to $400 a month depending on when you sign up, covering a limited connector set and Flexpoints allowance. Business and Enterprise tiers are priced individually based on connector count, refresh frequency and data volume, so it’s worth getting a quote before assuming a number.
Google Analytics
Where the tool shines
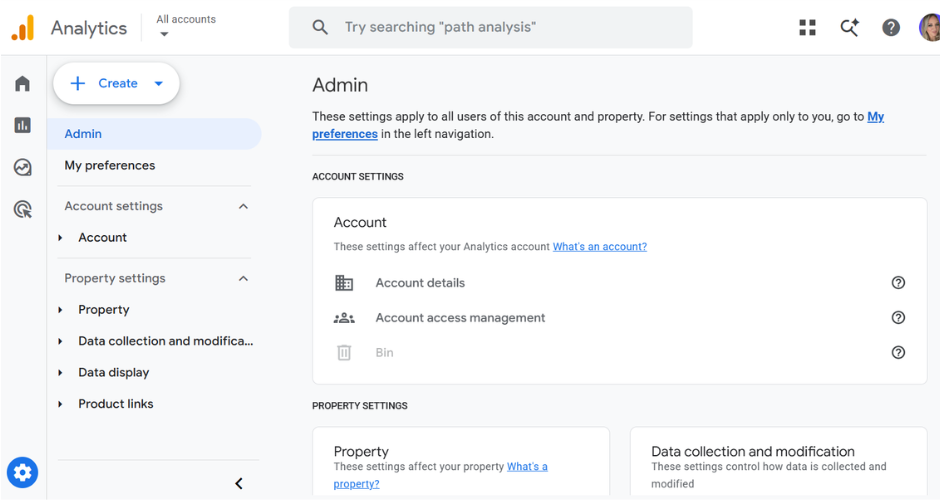
Google Analytics 4 is free, deeply integrated with Google Ads, and it’s the default measurement layer most PPC teams are already using whether they think of it as a reporting tool or not. Event based tracking, acquisition and conversion reporting, and native linking with Google Ads and Search Console make it a sensible starting point, particularly for smaller businesses that don’t need anything more sophisticated yet.
Where it falls short
The free version comes with real limits, data retention capped at 14 months, sampling on larger datasets, and a ceiling on custom dimensions, audiences and event parameters that more established accounts can bump into. It’s also a single-platform view by design, so anything happening outside Google’s own ecosystem, offline conversions, CRM data, or other ad platforms, has to be brought in separately if you want a fuller picture.
Pricing
GA4 is free. Google Analytics 360, the enterprise version, removes most of the sampling and retention limits and adds BigQuery export and an advertising workspace, but it’s priced on a custom basis that has historically started somewhere in the region of $12,500 a month, so it’s really only relevant once you’re operating at serious scale.
Supermetrics

Where the tool shines
Supermetrics is one of the more established names in marketing data extraction, connecting over 100 platforms including Google Ads, Meta and GA4, and pushing that data into destinations like Google Sheets, Looker Studio, BigQuery or Excel. It’s a solid choice for teams that already have a preferred place to visualise data and just need a reliable, well maintained pipe to get raw Google Ads data there on a schedule.
Where it falls short
Supermetrics is a data connector rather than a full reporting platform, so it moves data but doesn’t build the dashboard, model attribution, or connect anything to CRM or revenue data on its own. You’ll generally need to pair it with a BI tool or spreadsheet to actually do anything with what it pulls through, which adds a layer of setup that all-in-one platforms don’t require.
Pricing
Entry plans start at $29 a month for a single connector or the Essential tier, covering core sources like Google Ads and GA4 with weekly refreshes. The Core plan moves up to $159 a month for a wider connector set and more frequent refreshes, and higher tiers scale further for teams needing more accounts, more destinations, or hourly data.
Whatagraph
Where the tool shines
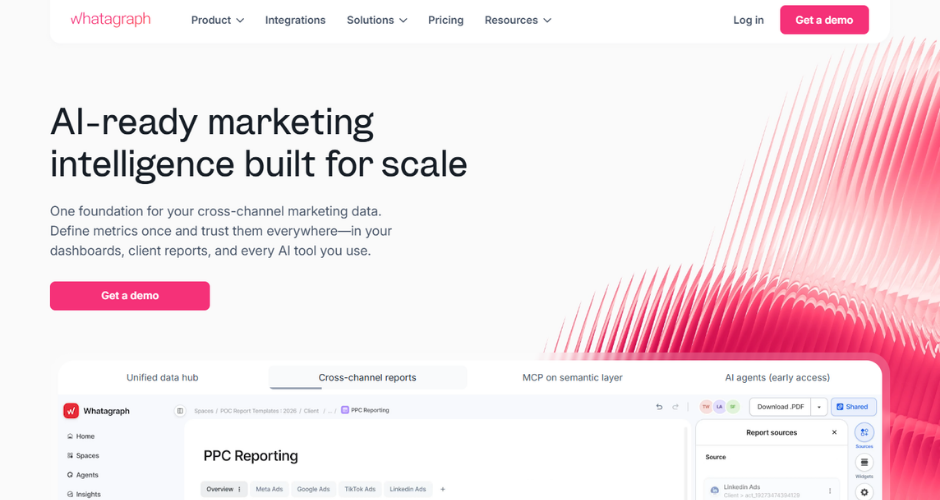
Whatagraph combines data connectors with genuinely usable reporting and dashboarding, so unlike a pure connector tool, you’re not left needing a separate BI layer to visualise anything. Its AI features (branded as Whatagraph IQ) let you build reports from a text prompt or ask natural language questions about your data, and white label branding is available for agencies presenting to clients under their own name. Every plan includes unlimited users and unlimited reports, which is a fairer structure than pricing by seat.
Where it falls short
Pricing runs on a source credit system rather than a flat fee, and the jump between tiers can be steep, agencies have reported a jump of a few hundred dollars a month between the entry and next tier once they need more source credits or want white labelling switched on. Some integrations, including certain email marketing and SEO platforms, are also locked behind the higher tiers rather than available from the start.
Pricing
The free plan includes 5 source credits with core integrations. Paid plans start from around $286 a month (or roughly €249) for the Start tier with 20 source credits, rising to around $579 to $624 a month for Boost with 50 to 60 credits and white labelling included, and custom pricing for the Max tier at higher volumes. Annual billing brings a discount on each tier.
Is Ruler the Google Ads reporting tool you’re looking for?
Every tool on this list will give you a read on performance, but very few will tell you whether Google Ads is actually generating revenue.
That’s the gap that dashboards and connectors, however good they are, can’t close on their own. Clicks, impressions and platform-reported conversions describe activity, not outcomes. The moment a lead goes into a CRM, picks up the phone, or takes weeks to turn into a sale, most reporting tools lose the thread entirely, and budget decisions end up being made on the half of the picture that’s easiest to measure rather than the half that matters.
That’s the gap Ruler Analytics is built to close. We connect Google Ads activity to online and offline revenue outcomes, deduplicate conversions across channels so you’re working from one honest revenue figure, model the influence of upper-funnel activity that never generates a click, and help teams plan budget based on where returns are strongest right now rather than where they were strongest last quarter.
It’s the layer that sits on top of whichever dashboard or integration tools you’re already using, turning “here’s what happened in Google Ads” into “here’s what Google Ads is actually worth to the business.”
If that’s a question your current reporting can’t answer, book a demo and we’ll show you what it looks like with your own data.