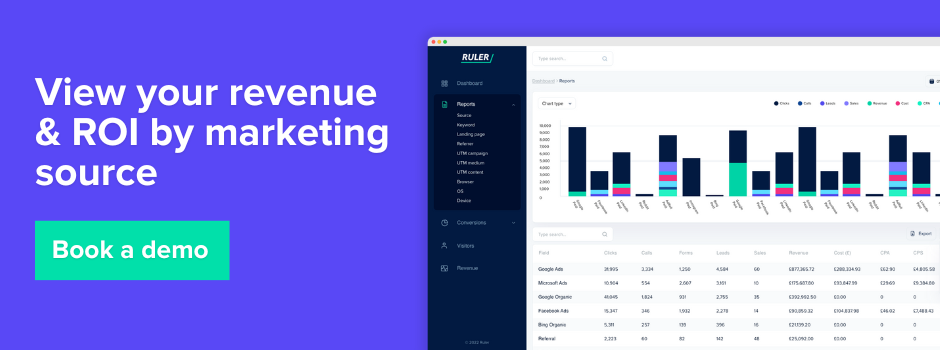
Tracking and forecasting revenue allows you to ensure consistent growth. Keep reading to see how you can accurately do both with Ruler.
Without tracking your leads through their full customer journey, you can’t know if your marketing efforts are working.
Think about it this way.
How can you know if your investments are paying off if you don’t know where your customers are coming from and what’s influencing their decisions?
Fortunately, there is a solution, and that is Ruler. In this article, we’ll show you how Ruler helps businesses link marketing to revenue and make better forecasting decisions by tracking the full customer journey.
Keep reading to learn:
- Why you need to track and forecast your revenue
- Tracking revenue with Ruler
- Forecasting revenue with Ruler
💡 TL;DR
Ruler Analytics is a marketing attribution and MMM tool that can help you track revenue and forecast more accurately.
Through its multi-touch attribution, Ruler tracks your customer journeys, from the initial touchpoint to conversion and beyond. This enables you to create a single source of truth and track how your marketing efforts are working together to drive revenue.
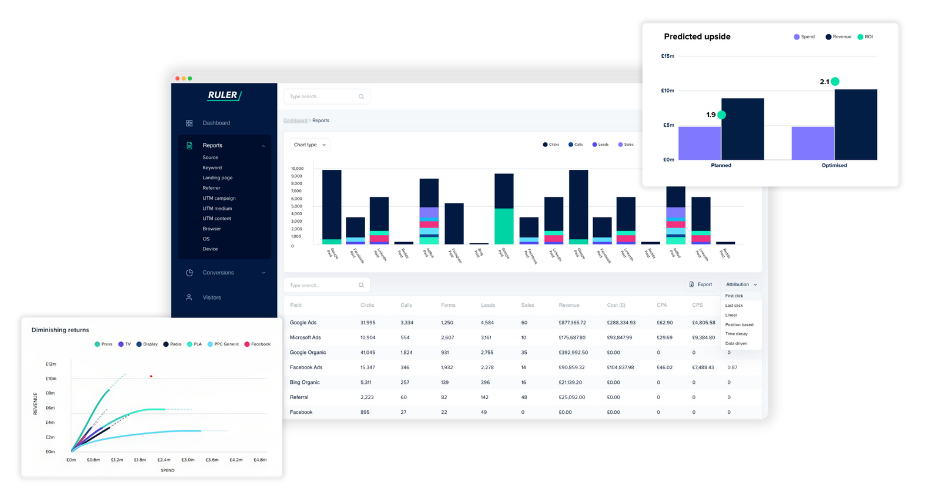
Ruler’s built-in marketing mix modeling also helps you identify diminishing returns across all your channels and shift your marketing budget to more effective channels and tactics, allowing you to forecast more accurately.
Skip the blog and book a demo to see how Ruler tracks and forecasts your revenue.
Why you need to track and forecast your revenue
Revenue and forecasting are essential for any business that wants to grow and succeed. By tracking and forecasting revenue, businesses can make better decisions about how to allocate resources, invest in new growth opportunities, and manage their cash flow.
Here are three key reasons why revenue and forecasting are so important:
Allows you to track metrics tied to your bottom line
Proving your digital ROI isn’t easy. Many marketers rely on workarounds, such as tracking the number of leads, to get a rough idea of their ROI. But in reality, they’re marketing blind.
Think of it like this. If you’re tracking leads – i.e. the volume of leads you create each month and you use this number as a benchmark, what are you actually tracking?
Let’s say in month one you generate 100 leads while in month two you generate 200.
Tracking leads only, it seems like month two is much more successful. But you only have part of the data.
With revenue tracking, you’d be able to see that month one generated £10,000 in revenue while month two generated £8,000. From this, we can clearly see that month one was better performing than month two.
This is useful as it allows you to get real context on your marketing initiatives. If you were optimising your marketing based on lead volume, you’d likely be hurting your overall performance.
Identifies new opportunities for growth
Revenue tracking should be more than just a holistic view.
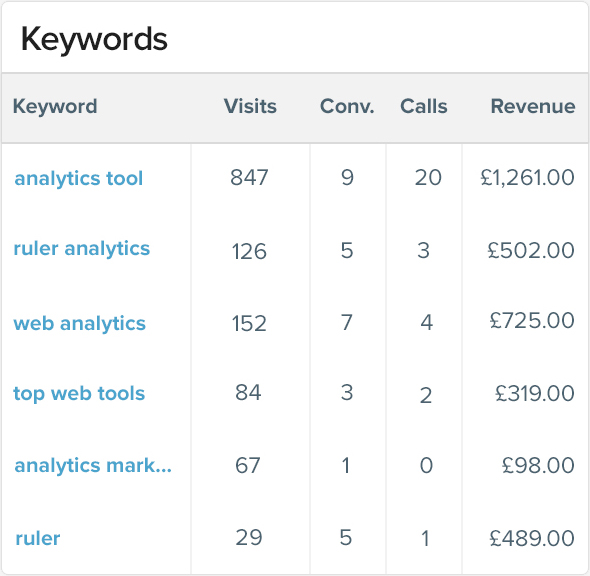
With the right tools, you can track revenue across small campaigns, content, and even keywords. This gives you more relevant data to make better business decisions.
For example, imagine you’re doing your usual end-of-month reporting and you discover that a campaign you launched drove a significantly higher number of sales and revenue than other campaign you’ve ran.
With this information, you can confidently reuse that piece of content, knowing that it’s proven to be valuable to your audience.
Leads to better budget planning and execution
Now that we’ve covered revenue tracking, let’s talk about forecasting.
Revenue forecasting is the process of predicting future revenue based on historical data and other factors, and it’s essential for budget planning.
Let’s use a quick example to explain. A business starts a Google Ads campaign and quickly sees a positive ROI. They increase their budget and continue to see good results.
However, after a while, their ROI starts to taper off as they reach the point of diminishing returns.
With Revenue forecasting, businesses can identify this point well in advance and reallocate their marketing budget to other campaigns that are more likely to generate the highest return.
How to track revenue with Ruler Analytics
Now that we understand the importance of revenue tracking and forecasting, let’s see how Ruler does it. We’ll start by covering the steps on how Ruler tracks revenue, and then we’ll move on to forecasting.
Ruler is a multi-touch marketing attribution tool. It breaks down the data silo between marketing and revenue by tracking anonymous website visitors across their entire customer journey, from first touch to conversion.
Let’s break it down:
A user visits your website. Javascript on your site connects to Ruler and allows it to track key information like their source, what pages they interacted with and their device.
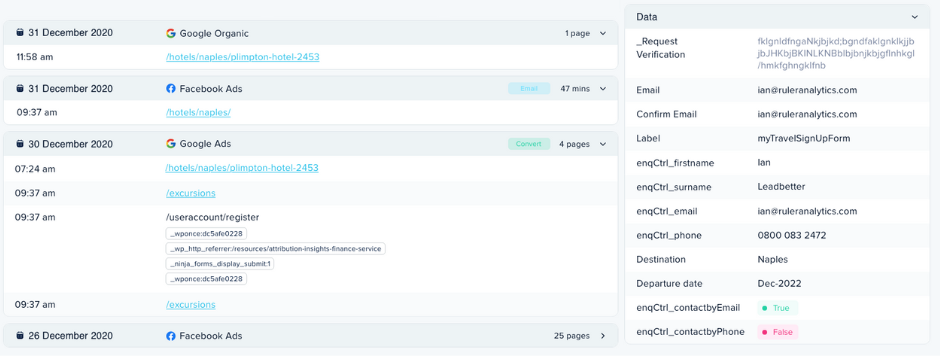
Every time that user visits your site again, Ruler will continue to track them, building up a customer journey.
Related: How to view full customer journeys using Ruler Analytics
When a user converts into a lead, Ruler will match them to their previous marketing touchpoints and send that data to your CRM, regardless of whether they converted by call, form fill, or live chat.
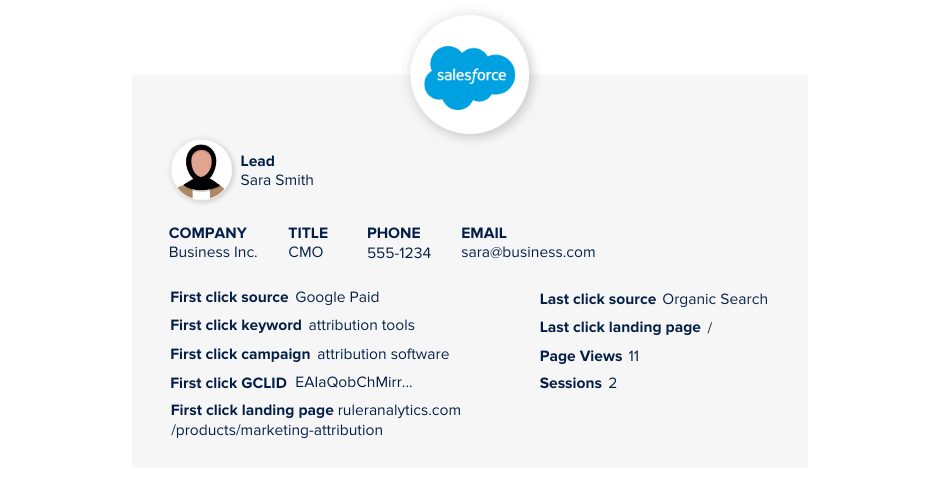
Your lead is in your CRM, and your full customer journey is visible in the Ruler app. You can drop in to your CRM to see how your leads are progressing through the pipeline and identify potential bottlenecks.
For example, you may find that a certain Google Ads campaign is effective at generating MQLs, but very few of those MQLs convert into opportunities.
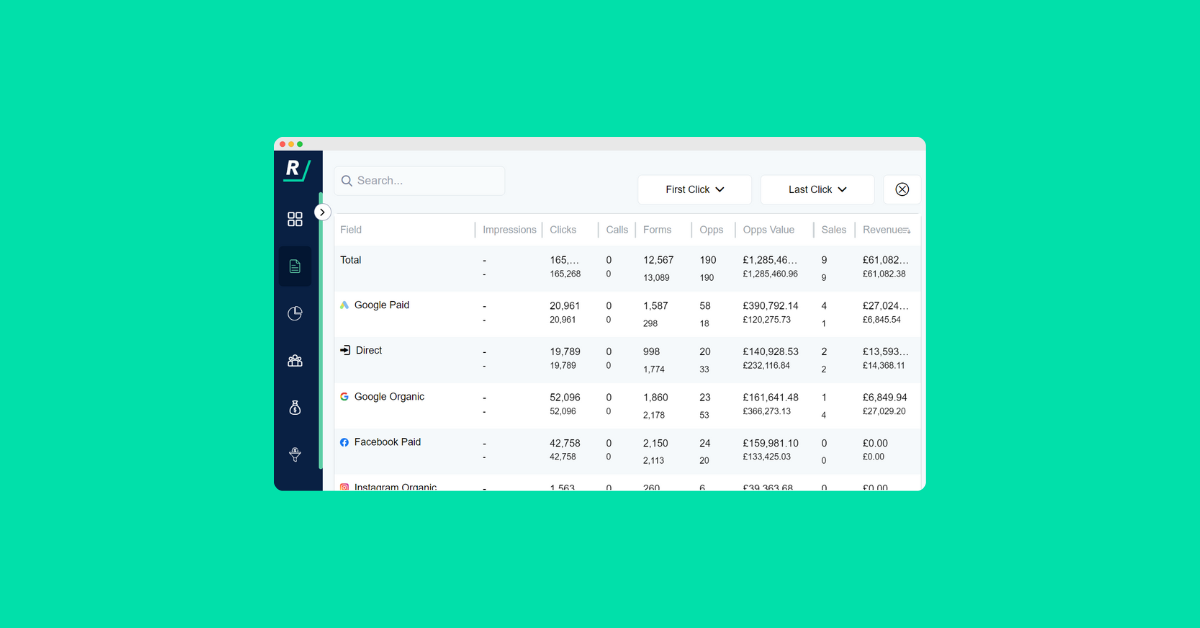
When your sales team closes a lead, Ruler links the revenue data to the marketing touchpoints that influenced the sale. Here, you can model your revenue using different attribution models and build reports to show exact values for marketing-generated revenue and ROI.
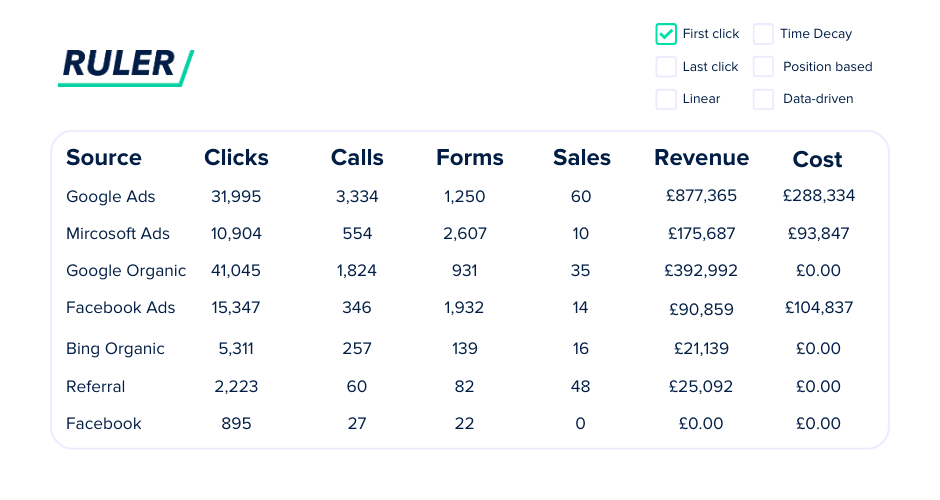
Ruler also integrates with other sales and marketing tools to create a single source of truth for attribution and revenue data, giving all teams access to the same information.
For example, at Ruler, we use ChartMogul to track changes in customer revenue and lifetime value. We’ve set up custom attributes in ChartMogul to capture Ruler’s marketing attribution data.
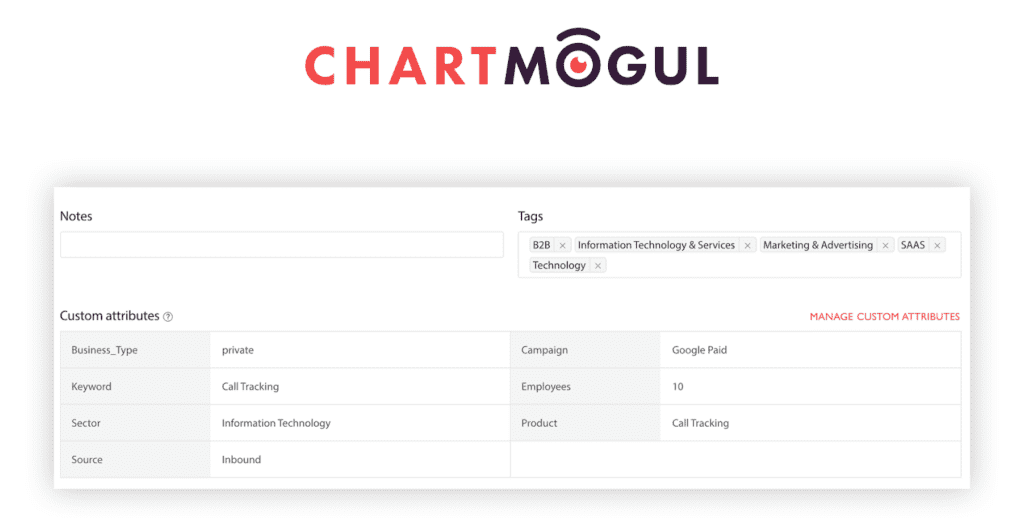
This allows us to manipulate data in ChartMogul to create custom reports and measure the impact of our marketing efforts on monthly recurring revenue and lifetime value.
With Ruler, you can see your closed revenue directly in the apps you need it most, which allows you to accurately attribute your revenue and track it throughout the full customer journey.
How to forecast your revenue with Ruler
Tracking ROI is just the beginning.
You should also track the duration of positive ROI and explore other marketing channels and tactics that may boost revenue more efficiently.
This is where Ruler’s marketing mix modelling steps in. MMM is a statistical analysis technique that helps marketers understand how different marketing channels and tactics impact revenue.
Related: What is marketing mix modeling? The future of marketing measurement
It’s used to identify the most effective marketing channels and tactics, and to forecast future returns.
Imagine you run a local car dealership and you’re using a variety of marketing tactics to attract customers:
- Meta ads: Targeting your local area.
- Tv ads: Appearing during prime time viewing hours.
- Radio ads: Played on local stations during popular drive-time slots.
Ruler’s MMM can analyse your sales data alongside your marketing spend for each channel. This helps you understand:
- Individual channel impact: How much additional revenue each channel generates (e.g., social media ads might bring in 10% more sales).
- Interaction Effects: How different channels work together (e.g., radio ads might remind people about a TV commercial they saw, increasing its effectiveness).
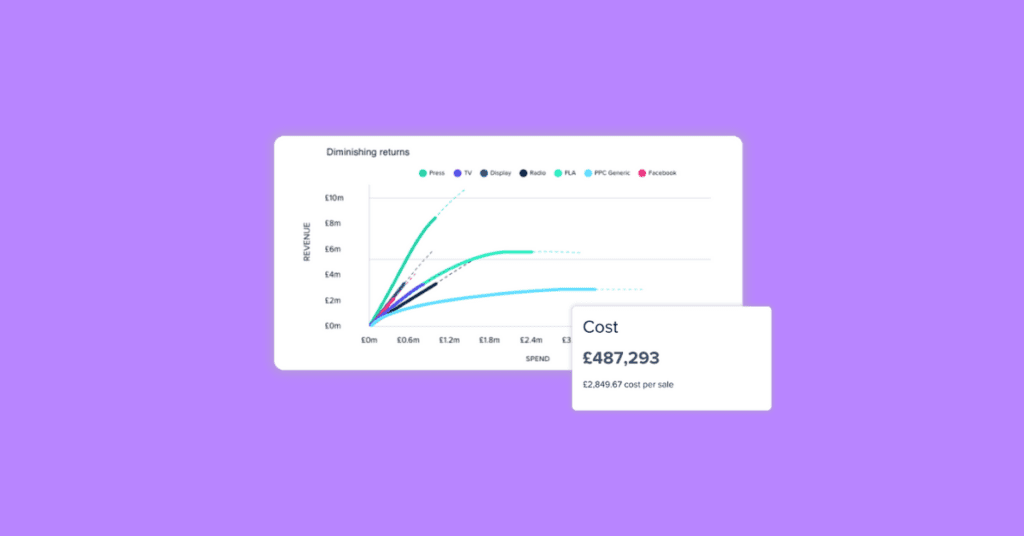
MMM can also reveal diminishing returns, particularly with social media ads.
While they might be your most effective channel, attracting new customers initially, as you increase ad spend to reach saturation in your local market, the additional revenue gained from each extra dollar spent starts to decrease.
With this information from MMM, you can make smarter marketing decisions.
You can optimise your social media spend by reducing ad spend slightly to maintain a level that delivers a positive ROI without overspending.
The money saved can then be used to explore new channels to see if they can reach new customer segments.
Additionally, you can refine existing channels by analysing which social media ad formats and targeting options work best, allowing you to refine your strategy and potentially improve returns.
By understanding both the effectiveness of individual channels and the concept of diminishing returns, MMM empowers you to optimise your marketing mix for maximum return on investment.
Getting started with Ruler’s revenue tracking and forecasting
There you have it.
A guide to getting started with forecasting and revenue tracking.
Remember, the key issue you’re likely struggling with is data disconnection. You might be using a multitude of different marketing tools to drive new traffic, leads and sales. But connecting the data you need across each of these isn’t easy.
With a tool like Ruler in place, you can get rid of the data headache.
All the hard work is done accurately and automatically, meaning less number-crunching for you. You’ll save time which you can then spend on optimising your marketing instead.
Want to see Ruler in action? Book a demo with our team and see how we can help you better track and forecast your revenue.