
Uncover the full story, generate better insights and make more informed decisions for your marketing using qualitative and quantitative data.
Measuring marketing success is trickier than ever.
Don’t take our word for it. Only 38% of marketing leaders are confident in their ability to measure the impact of their marketing activities.
The era of data privacy and the sunset of third-party cookies have thrown traditional measurement into chaos.
On top of this, the customer journey is getting increasingly complicated, with more and more touchpoints across different channels.
Marketers have been left scrambling, unsure of how to quantify the impact of their campaigns and understand their customers on a deeper, more meaningful level.
If you find yourself in a similar situation, you’ve landed in the right spot.
We’ve joined forces with Yan Pallada, Partnerships & GTM at Fathom.video, to guide you through this evolving landscape, offering a comprehensive guide on merging quantitative and qualitative data to enhance your understanding of your audience and marketing performance.
Here’s what we’ll cover:
- Definition of qualitative data and the different types
- Methods of qualitative data collection
- Definition of quantitative data and the different types
- Methods of quantitative data collection
- The importance of combining quantitative and qualitative data
- Tips to combine qualitative and quantitative data
💡 Pro Tip
Combining qualitative and quantitative data provides a well-rounded picture of effectiveness.
For example, quantitative tools like Ruler provide the “how” by tracking your visitor journeys, revealing the specific touchpoints leading to conversions and revenue. Qualitative solutions like Fathom.video bring the “why” by adding valuable context through recording lead conversations, allowing you to uncover the emotions and any hidden motivations behind their decisions.
Skip here to see how Ruler and Fathom.video can work together to unlock deeper customer insights and validate your marketing’s effectiveness.
What is qualitative data in marketing?
For marketers, qualitative data encompasses the rich, descriptive insights gathered from customer interactions across various touchpoints.
It’s the words that come out of your customers and prospects mouths, it’s what you can’t see on a data spreadsheet.
Unlike quantitative data, which quantifies customer behaviour through metrics like website traffic or conversion rates, qualitative data offers a deeper understanding of the customer’s journey, their pain points, motivations, and preferences.
It’s the feedback in a customer support ticket, the discussion during a product demo, or the comments made during a customer success follow-up call.
What are the different qualitative data collection methods?
SaaS companies can gather valuable qualitative data from several key touchpoints:
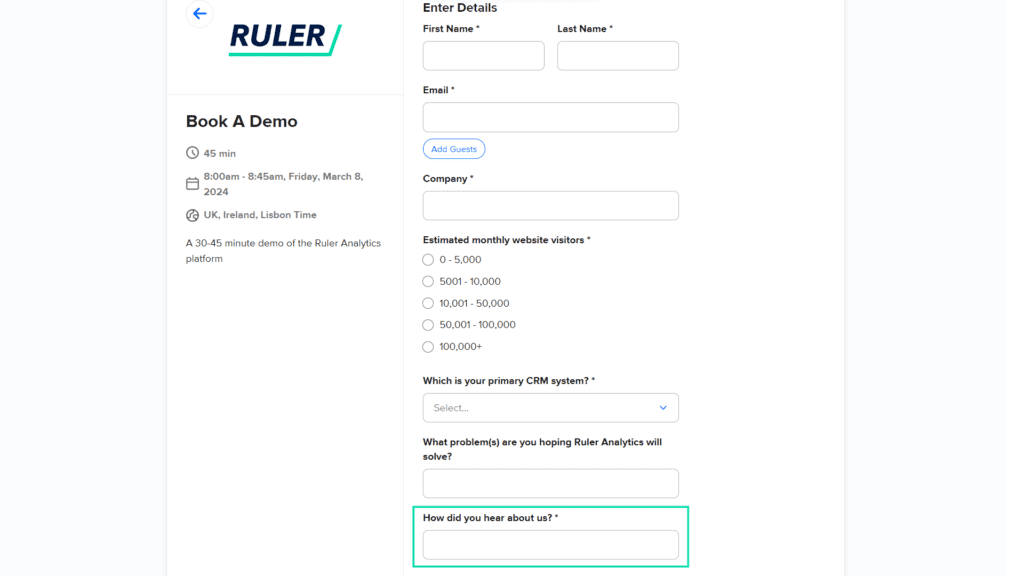
- Customer interviews: In-depth conversations with customers that delve into their experiences, outcomes, and satisfaction levels with your product, providing insights into what is or isn’t working
- “How did you hear about us” fields: Reveals customer acquisition channels and initial brand interactions, including hard-to-track sources like word-of-mouth and dark social.
- Sales & success interactions with customers: Recorded calls, meeting notes, and follow-up emails from your sales and customer success teams can provide a wealth of information on customer needs, objections, and the perceived value of your solution.
💡 Pro tip: You can use tools like Fathom’s free AI meeting assistant to capture your calls and automatically sync them directly into your CRM and other workflows.
- Product feedback sessions: Sessions that collect direct input from users about specific features or updates, offering detailed insights into the product’s utility and areas for improvement.
- Support ticket analysis: An examination of customer support interactions to identify common challenges or barriers faced by customers, highlighting potential areas for product enhancement or customer education.
- Social media engagement: Analysis of comments, direct messages, and public posts that reflect public sentiment towards your brand, product, or industry trends.
- G2 and review sites: Customer reviews and feedback on platforms like G2 provide unfiltered insights into customer satisfaction, product performance, and market position. These platforms can be especially useful for capturing intent and raw feedback from both current customers and prospects.
Integrating these qualitative data sources into your marketing strategy allows for a comprehensive understanding of your customer base, enabling more targeted, informed decision-making that drives growth and improves customer satisfaction.
What are the best practices for collecting qualitative data?
To leverage qualitative data for refining marketing strategies, marketers should:
- Integrate across touchpoints: Ensure mechanisms are in place to capture feedback across all customer interactions, from sales calls to product onboarding and support. Remember, Fathom’s AI Meeting Assistant transcribes, highlights, and summarises your meetings to ensure no crucial interactions are overlooked.
- Encourage open feedback: Create an environment where customers feel valued and encouraged to share their honest opinions. This can be achieved through regular check-ins, feedback forms, and user communities.
- Analyse for actionable insights: Systematically review the qualitative data to identify recurring themes, sentiments, and suggestions. Tools like text analysis software can help scale this effort for larger datasets.
- Close the feedback loop: Act on the insights gained by informing product development, adjusting marketing messages, and tailoring customer success strategies. Communicate back to customers how their feedback is shaping your offerings.
- Benchmark and measure impact: Establish qualitative benchmarks to gauge customer sentiment and loyalty over time, such as Net Promoter Score (NPS) or Customer Satisfaction (CSAT) scores, and correlate these with changes in your product or marketing strategy.
What is quantitative data in marketing?
Unlike qualitative, quantitative data is any information that can be quantified, meaning it can be counted, measured, and expressed as numerical values.
Think numbers, statistics, and hard facts.
For example, metrics like website traffic, click-through rates, and conversions fall under the category of quantitative data.
Here are the key characteristics of quantitative data in marketing:
- It’s countable or measurable, relating to numbers.
- It’s objective and free from personal bias, making it reliable for analysis.
- It answers questions such as “how many, “how much”, and “how often”.
- It offers an easy comparison between different data points.
- It can be used to build predictive models that forecast future trends.
What are the different types of quantitative data?
Since this section focuses on quantitative data, it helps if we highlight its different distinctions.
Quantitative data falls into two categories: Discrete and Continuous.
Let’s take a deeper dive into each type to grasp their characteristics and differences.
Discrete
When you measure website visitors or monitor social media engagement, you’re working with discrete data. Each website visit and every social media action—such as a like or comment—is separate and distinct. Discrete data comes from counting events, sorting them into categories, or ranking them.
Other examples to consider:
- Number of conversions/leads
- Product units sold
- Click-through rates (CTRs)
- Survey responses with multiple-choice options
Continuous
Now, consider measuring website session duration or monthly recurring revenue. Here, we’re dealing with continuous data—values that span a continuous range and can be measured in diverse units.
For example, session durations can vary from milliseconds to minutes, and your monthly recurring revenue can fluctuate from hundreds to thousands from one month to the next.
Other examples to consider:
- Revenue
- Customer lifetime value (CLTV)
- Product return rates
- Survey responses on rating scales
Both discrete and continuous go hand in hand. Continuous data is key for tracking trends and patterns, while discrete data helps you understand overall values.
Think about it this way:
You wouldn’t just count leads without considering their value, right?
What are the best quantitative data collection methods?
The quantitative data collection method you choose will depend on the type of questions you’re looking to answer, the data you need and the resources and time available to you. Here are a few data collection methods to consider.
Analytics tools
Traditional analytics tools like Google Analytics and Mixpanel offer an easy way to collect and analyse quantitative data regarding your website traffic, measuring metrics such as page views, time spent on pages, sessions and conversions.
Related: 16 marketing analytics tools for data-driven marketers
But, these tools can’t tell you who the users are behind specific actions. While they can show that a marketing channel led to 100 demo requests, details about the involved users fall short.
Related: 6 limitations of GA4 and how to overcome them
For a better understanding of users and their individual interactions, marketing attribution tools offer a more suitable solution.
Unlike traditional web analytics, these tools delve into the complete customer journey, tracking each touchpoint across various channels and platforms.
Take Ruler, for example.
Ruler uses first-party cookies to track your visitors. When a user visits your website for the first time, Ruler will assign a unique identifier to their session. Below is an example of Ruler tracking a visitor’s journey in its dashboard.
Related: How to view full customer journeys with Ruler
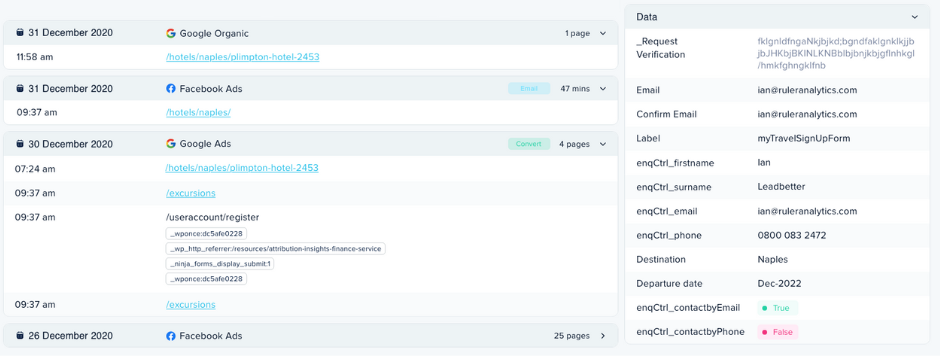
📷 Customer journey tracking in Ruler
Every time a user returns to your website, Ruler’s code will fire and automatically associate that visitor with their previous sessions to create a cross-channel journey.
When a user converts, either by form fill, phone call or live chat, Ruler will match this new lead to their previous marketing interactions and fire it to your CRM.
Not only does it allow you to quantify conversions, but it also offers detailed insights into the individuals responsible for your conversions.
Additionally, you can track whether these leads eventually result in won deals, allowing you to measure the direct impact of your marketing efforts on revenue.
💡 Pro Tip: Ruler is a next-generation measurement solution that uses first-party click tracking and machine learning impression modelling to help marketers measure and validate marketing impact on revenue and optimise for maximum performance. Book a demo to see more.
Heat mapping tools
Traditional analytics are valuable, but they can leave you with a fragmented understanding of user behaviour.
Beyond just being pretty, heat mapping tools excel at collecting quantitative data, providing invaluable insights into user preferences, engagement patterns, and potential pain points.
Heat mapping tools track user actions like clicks, taps, scrolls, and mouse movements, translating them into a density map.

📷 Heatmapping via FullStory
Additionally, they dive deeper into user engagement by measuring dwell time—the length of time users spend on specific areas.
Remember our exploration of discrete and continuous data? Well, this is where it all comes together.
Through the integration of visual data obtained from heat mapping tools with your web analytics data, you can develop a more accurate and measurable understanding of your audience and the effectiveness of your marketing strategies.
Closed-ended surveys
While surveys and questionnaires are the cornerstone for qualitative data collection, they are equally effective for quantitative data gathering.
Unlike qualitative surveys, where participants can freely express themselves through open-ended questions, quantitative surveys present closed-ended questions that require respondents to select from predetermined options, such as yes or no, or multiple-choice selections.
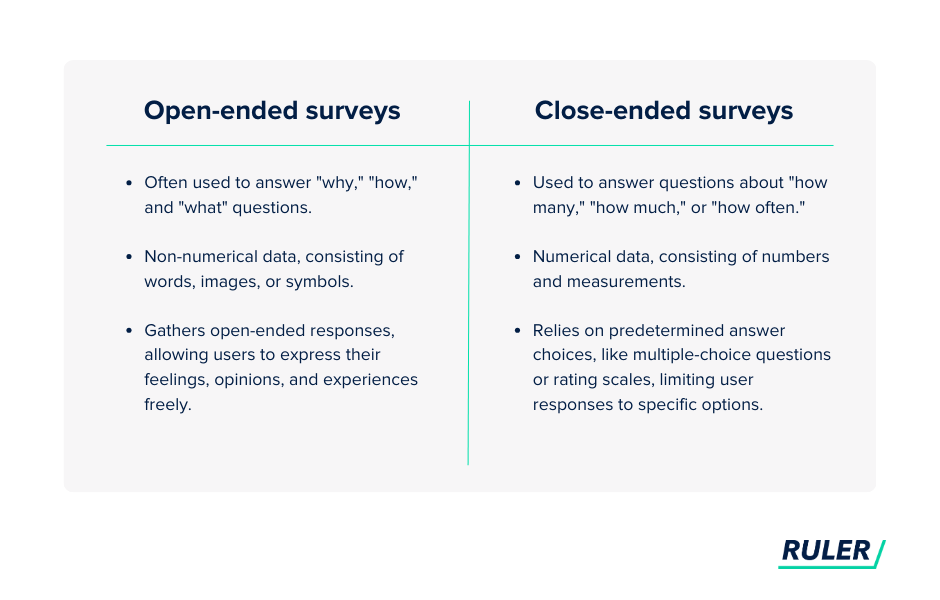
Here are a few examples:
- “Where did you hear about our brand?” (Multiple choice with options like “social media,” “TV advertising,” “word-of-mouth”).
- “What influenced your decision to purchase our product?” (Multiple choice with options like “price,” “brand reputation,” “product features”).
- “How likely are you to recommend our brand to others?” (Net Promoter Score question with a scale of 0 to 10).
You can take the answers from these survey questions and convert them into numerical data, allowing for statistical analysis and the generation of quantitative insights.
Additionally, interviews, often used for qualitative research, can also be modified for quantitative purposes by asking structured questions with standardised responses.
You can use a set list of questions and record consistent responses, ensuring uniformity and enabling the conversion of qualitative insights into quantitative data.
The importance of combining quantitative and qualitative data
Both qualitative and quantitative data are key for making smart decisions.
Quantitative data highlights trends and correlations, and qualitative data delves deeper into motivations, experiences, and sentiments behind the numbers.
But while both types of data are valuable, relying on either one in isolation can lead to a skewed or limited understanding of your marketing.
Let’s use an example to unpack this a bit more.
Imagine you’re using Ruler to track user sessions on a website.
The quantitative data shows that a visitor went through different pages, eventually converting into a lead. It pinpoints the marketing touchpoints and pages they interacted with along the way.
You can track clicks, conversions and revenue, which are invaluable for optimising website content and allocating marketing resources, but understanding the motivations and emotions behind those actions remains a mystery.
Why did they come to your website in the first place? What problem are they trying to solve? Why did they convert?
Simply relying on quantitative data paints an incomplete picture. This is where qualitative data steps in.
Through the use of qualitative methods, like open-ended fields in web forms and video note-taking tools like Fathom, you can capture the nuanced details and emotions that quantitative data misses.
You can add additional fields to your forms, allowing leads to express their challenges and elaborate on how they found your services through untrackable touchpoints not often captured by quantitative methods.
Additionally, Fathom can record and capture conversations with leads during initial calls to help you validate your marketing and drive deeper insights.

📷 AI Meeting Assistant via Fathom.video
Combined with the quantitative data collected using a tool such as Ruler, you can achieve a full picture of your lead’s journeys from start to finish and their motivations, allowing you to:
- prove the value of your marketing actions and budget allocations
- measure the trackable (and untrackable) interactions leads have with your brand
- identify challenges and new key themes that you can incorporate into your messaging
- optimise your marketing to drive maximum traffic and revenue.
Tips to combine qualitative and quantitative data
To help you on the path of aligning qualitative and quantitative data, we’ve outlined a few steps you can take to improve the way you integrate and analyse these two types of information.
- Define clear objectives: First things first, establish your goals. Think about the questions you want to answer and the insights you want to extract from the combined data. Do you want to understand customer motivations and preferences, optimise your campaigns for more revenue, or refine audience segmentation? Aligning your objectives with the appropriate data sets will provide a clear roadmap for the journey ahead.
- Plan your approach: There’s no one-size-fits-all solution. What works for one company might not work for another. You need to ensure that your data collection methods align with your objectives. For example, If you’re optimising ad campaigns and landing pages and need to track conversion rates and analyse call response patterns, tools like Ruler and Fathom can provide valuable insights. However, if your goal is to collect user feedback on specific products, then a survey might be a more effective approach.
- Get buy-in early on: Involve your marketing, sales, and even product development teams in the planning and implementation process. This ensures everyone understands the objectives and can contribute valuable insights from their own perspectives.
- Create a holistic analysis: Avoid presenting your qualitative and quantitative data as separate entities. Use your qualitative findings to enrich and explain quantitative trends and vice versa. Weaving your quantitative and qualitative data allows you to create a complete picture that tells a story beyond just numbers or feedback.
- Communicate effectively: Remember, communication is key. Present your findings in a clear, concise, and visually appealing manner. Have a particular focus on stakeholder needs and preferences. Chances are your stakeholders will want to see the parts of your strategy that are working to drive revenue. So leverage both qualitative and quantitative data, along with concrete examples, to showcase how your strategy has directly contributed to increased revenue wherever possible.
Final thoughts on qualitative and quantitative data
While both quantitative and qualitative data offer valuable insights, their true strength lies in their synergy
Quantitative data provides the “what” and “how much,” while qualitative data illuminates the “why” and “how.”
Just like looking at a picture through different lenses provides a more complete view, combining both types of data leads to a deeper understanding.
If you’re ready to enhance your qualitative data collection through video note-taking, consider signing up to Fathom.video.
For those seeking to generate high-quality qualitative data through marketing attribution, book a demo with Ruler.