Not sure you’re tracking the right numbers? We run through the key revenue metrics that you need to track to understand your impact better.
Management guru Peter Drucker famously said, “If you can’t measure it, you can’t manage it.”
While not everything is measurable, and we might still need to make decisions on items we can’t accurately track, using data to inform our decisions can make a huge difference to the results we achieve.
Revenue tracking has been under fire for a while now, with the sunset of cookie-based tracking set to happen next year.
Standard Universal Analytics will stop processing data from 1st July 2023 onwards, and Google Analytics 4 will become Google’s next-generation measurement solution.
We asked June Gil, Head of Digital Performance from Fluid Commerce, to share her thoughts on the best revenue metrics to track to help alleviate this data shift.
You’ll learn the six revenue metrics you should be tracking and why these revenue metrics are important.
How to understand the true impact of revenue
One of the biggest shifts moving from Universal to GA4 is that it switches from tracking session-based revenue to user-based revenue.
User-based revenue provides a more realistic return on investment per user and it will help measure returns in today’s complex user journey.
Marketers must not only identify which revenue-related metrics are important to their business, but also measure revenue in more channels across multiple device types.
Making sense of all this data and transforming it into actionable insights will be crucial when it comes to improving performance.
Best revenue metrics to track
Depending on your business type, there are some revenue metrics that can have a huge impact on your performance. In this blog post, we will cover some of these metrics, how to calculate them, and how you can use them to improve your brand’s performance.
These include:
- Return on ad spend
- Average profit margin
- Lifetime customer value
- Average order value
- Assisted revenue
- Customer acquisition cost
Return On Ad Spend
Working out your return on ad spend (or ROAS) is a simple calculation and most businesses have a good grasp on this metric.
Related: Complete guide to return on ad spend
However, being too inflexible with this metric can sometimes hinder business growth.
While existing customers tend to generate an extremely high ROAS, expanding your reach and going after new customers is going to be essential if your goal is to grow your sales.
According to an Invesp survey, it costs five times as much to attract a new customer than to keep an existing one. When we take into account the lifetime value of a customer, acquiring new customers can sustain a lower ROAS, especially if repeat purchase is likely. So don’t be afraid to lower your ROAS targets when it comes to acquiring new customers.
Related: How to track leads and conversions from PPC
Average Profit Margin
You might be getting a healthy average ROAS, but if margins are too thin for some products, you might actually be losing on them.
While some business strategies rely on these loss leaders to bring in traffic and make their money elsewhere, splitting your products based on margins can have a big impact on revenue and ROAS.
To calculate your profit margin at product level, you can subtract the cost of producing the product from its price per unit. Once you have your product margins calculated, you can create product groups based on similar margin levels, and use this to make decisions around how much visibility to give them (higher for higher-margin products).
This is based on B2C revenue generation.
Tracking your revenue is tricky when you’re working with B2B products. Connecting your B2B business to leads, and then also revenue is a little bit more difficult.
Lifetime Customer Value
Lifetime customer value, or LCV, can vary widely depending on the business model.
Usually, higher-priced products or products that are not an everyday necessity can see a lower LCV as users tend to not repeat purchase.
Lower-priced items or those that need to be replaced often will see a higher LCV. And of course, subscription models rely heavily on making this value as high as possible for their success.
To calculate it, we’d need to look at the average basket value and the average length of time a user is a customer for. Let’s imagine your customers spend £50 on average, purchase once per month, and they usually stop purchasing after two years on average. If we multiply:
£50 x 12 months x 2 years = £1,200 LCV
The Invesp survey mentioned above points out that 44% of companies have a greater focus on customer acquisition vs. 18% that focus on retention.
And while it’s important to acquire new customers so we don’t become stagnant, finding ways to increase the number of purchases you can get from an existing customer can give you added revenue for a lower cost.
Average Order Value
Average Order Value (AOV) relates to the size of your average basket. Most brands tend to see a fairly static value on a monthly basis, with fluctuations tied to seasonality (ie. Black Friday or Christmas) or when there’s a sale on.
Taking steps to increase your AOV can have a huge impact on revenue levels. This is especially true if conversion rates are already high and you can only get small incremental gains there.
There are several ways to do this:
- Upselling products can motivate users to add related items to their purchase, which they might not have looked for otherwise
- Making low-priced items less visible can help ensure purchases are focused on higher-priced items
- Experiment with discounts as it can stimulate users to purchase bigger quantities
- AOV can sometimes be tied to your free delivery threshold. Often, users purchase enough to get over this value so they can get their items delivered free of charge. Increasing this threshold slightly might encourage them to purchase an additional item, which will help revenue
Assisted revenue & cross-device revenue
Nowadays, a user’s purchase journey often includes different touchpoints and devices, and all of them contribute to the final sale. This is assisted revenue.
Having so many touchpoints makes revenue measurement a lot more complex. Plus, it can make the customer’s experience worse due to lack of consistency across channels.

Source: Think With Google
For example, your social ads might not be delivering a good ROI. But if they operate mainly in an assist role (with users learning about the brand through said ad, then going on the website through direct traffic, and finally converting through an email) and you turn the ads off, you might see overall revenue plummet.
While there isn’t a perfect formula to track users across multiple channels and devices, especially when the switch happens from online to offline or vice versa, being aware of how a customer moves through a purchase journey by using reporting tools like GA4 can ensure you’re giving each channel the value they deserve.
Marketing attribution is one way to track your leads and sales when users are engaging with your content across different channels and sources.
Customer acquisition cost
While many marketers use metrics like clicks, impressions or even cost per click, they don’t really dig down under the surface of what’s going on in your marketing.
Understanding how much you need to spend to get new customers is vital to know how efficient your marketing efforts are.
Related: How to attribute revenue to your marketing
Linking revenue to your marketing isn’t always easy, but it isn’t impossible.
By understanding CAC, you can optimise your marketing based on what works. It’ll give you the insight to see where to put your time and budget.
Related: How to reduce your customer acquisition cost
How to use these revenue metrics to optimise your marketing
Defining and tracking all these revenue metrics can be challenging and time-consuming. But it can give you the upper hand your business needs when it comes to making decisions to improve performance.
Marginal improvements in any of these metrics can have a bigger long-term impact than a more radical change could. Plus, they’re often easier to implement.
Marketing attribution can support you to track, evidence and optimise your marketing.
Related: How to optimise your marketing with attribution
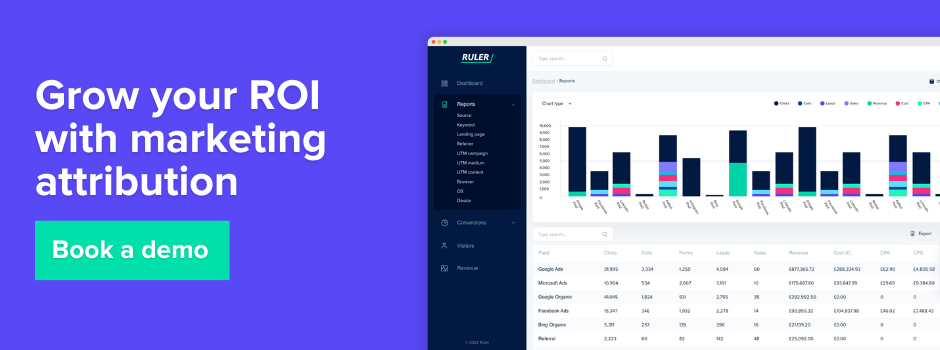
Book a demo of leading attribution product, Ruler Analytics. Or, get in touch with the team at Fluid. With our award-winning team, better understand how to track marketing activities and measure your revenue metrics.