
From our conversations with marketing leaders and demand gen teams, one frustration comes up more than almost any other. Budgets get approved based on numbers that don’t quite add up, campaigns get cut because a spreadsheet says they underperformed, and nobody in the room can fully explain where the figures came from.
It isn’t that anyone is doing anything wrong, rather that measuring marketing has genuinely got harder, and most teams are still working with tools that weren’t built for how customers actually behave today.
Few customers make an important purchasing decision in a single session anymore. They research across channels, engage with a handful of ads, and often convert in ways that leave little or no digital trace. By the time a sale happens, many of the touchpoints that influenced it have already been forgotten by a standard attribution model. Add in offline conversions and inconsistent platform reporting, and it’s easy to end up making budget decisions on an incomplete picture.
This matters because most teams do trust their data, even when that data is incomplete. In our own research, 64% of respondents told us they base the majority of their marketing decisions on data in analytics, yet only 50% said they were fairly confident in their reporting. That gap between how much weight the data carries and how much marketers actually trust it is exactly the problem this article sets out to address.
Pro tip
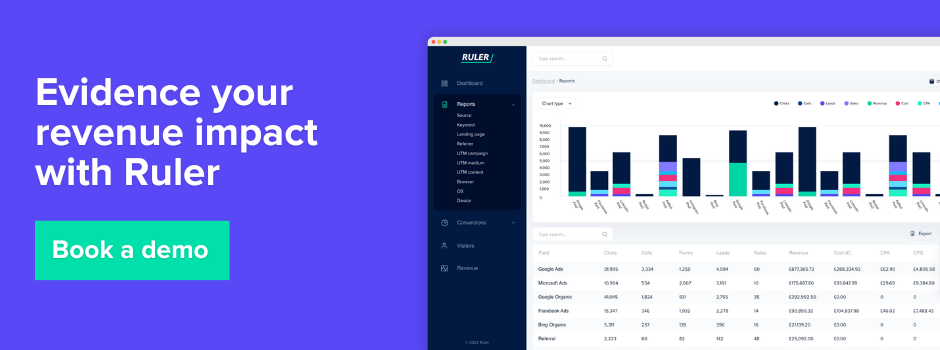
If any of the above sounds familiar, it’s worth seeing how first party tracking and multi touch attribution can close these gaps before you commit next quarter’s budget. Book a demo with Ruler Analytics and we’ll walk through your own data.
What we mean by performance marketing software
We use performance marketing software to describe any platform that helps teams measure, attribute, and optimise the return on marketing activity, rather than simply reporting on traffic or engagement. That’s a broad category, and it’s worth being upfront about that, because it covers several genuinely different types of tool.
Some platforms, like Google Analytics, focus on web and app behaviour. Others, like Supermetrics and Funnel.io, focus on pulling data out of ad platforms and into a single place. Reporting tools like DashThis focus on visualising that data for clients and stakeholders. Account based platforms like Demandbase focus on identifying and engaging target accounts. Product analytics tools like Amplitude focus on user behaviour inside a product.
And attribution and marketing mix modelling platforms like Ruler Analytics focus on connecting marketing activity all the way through to revenue.
What ties them together is the underlying goal. Every tool in this list exists to help marketing leaders answer a version of the same question, which channels, campaigns, and touchpoints are actually driving business results, and where should the next pound or dollar of spend go.
What we recommend looking for in performance marketing software
Based on the conversations we have with marketers evaluating this space, and verified against what these platforms publish about themselves, a few things consistently separate a good fit from a frustrating one.
- First party data collection. Third party cookies are becoming less reliable, and platforms that depend on them will only get less accurate over time. Look for tools that can track conversions using first party methods that hold up as the privacy landscape shifts.
- Multi touch or data driven attribution. Last click attribution undervalues upper funnel activity almost by design. A platform that can model several attribution approaches side by side gives you a fairer view of what’s actually working.
- Offline and CRM integration. If a meaningful share of your revenue comes from calls, forms, live chat, or offline sales, your measurement tool needs to be able to match that activity back to the marketing that generated it.
- Forecasting and budget planning, not just historical reporting. Knowing what happened last quarter is useful. Knowing what’s likely to happen if you shift 15% of budget from paid social to CTV is more useful still.
- Genuine ease of use for the people who’ll actually use it. From what we’ve found from conversations with marketers, the most sophisticated platform in the world adds little value if only one person on the team understands how to use it. Onboarding, support, and a sensible interface matter more than they’re usually given credit for.
- Transparent, predictable pricing. Several tools in this space use custom or usage based pricing that scales in ways that are hard to predict up front. It’s worth asking for a clear breakdown before you commit.
It’s also worth acknowledging that having the data isn’t the same as being able to act on it. 23% of respondents in our own research told us that turning data into actionable insights is a main challenge with marketing data analytics, so ease of use and clear reporting matter just as much as raw capability when you’re shortlisting tools.
Performance marketing software reviewed for 2026
With everything we’ve discussed so far, here’s how we and the tools we’ve reviewed stack up.
Ruler Analytics
What we’ve designed it to solve
Ruler was built to close the gap between marketing activity and revenue, particularly for businesses with longer consideration windows, offline sales, or a meaningful volume of phone and form based leads. We built it around the idea that first party tracking should provide the underlying data, capturing calls, form submissions, live chat, and other conversions through a first party JavaScript tag that follows the full customer journey from first visit through to revenue, while statistical modelling and machine learning do the heavier work of turning that data into decisions you can act on.
Multi touch attribution lets you compare models side by side, including first click, last click, linear, position based, time decay, and data driven, and Ruler matches enquiries and sales back to CRM records so you’re reporting on revenue attribution rather than just lead or conversion volume. ROAS reporting is available at channel, campaign, ad group, ad, and keyword level.
Where we’ve focused most of our recent development is marketing mix modelling and budget optimisation. Ruler’s data driven attribution model combines click path data with impression weightings derived from marketing mix modelling, shifting credit away from over attributed channels like direct and brand search and towards the upper funnel activity that influenced the decision but never earned a click. For businesses investing in channels such as CTV, display, video, out of home, or other awareness campaigns, this gives a far more complete picture of what’s actually driving performance. The statistical modelling behind it accounts for seasonality, competitor activity, economic conditions, and diminishing returns across more than thirty variables at once, and it’s fed by both historical performance and forward looking budget forecasts.
That modelling then feeds a budget scenario planner, which shows diminishing return curves for each channel so you can see where a channel is approaching saturation and where extra investment is likely to generate incremental revenue. You can model efficiency, growth, or custom budget scenarios before committing spend, so decisions are based on predicted outcomes rather than assumptions. If you want more detail on how this kind of budget allocation through marketing mix modelling works in practice, we’ve written about it in more depth on our blog.
Ruler also ingests data from advertising platforms, CRM systems, and other business tools, then pushes enriched attribution data back out again. CRM records get updated with source, campaign, and customer journey data, while ad platforms receive offline conversion and revenue signals that improve bidding and audience optimisation. In other words, the attribution data doesn’t just sit in a dashboard, it actively feeds back into how campaigns get run.
Where we see it work best
Businesses with longer sales cycles, a meaningful share of phone or form based enquiries, and marketing teams that need to justify spend across several channels, including offline and upper funnel activity, to finance or leadership.
Consider Ruler if
You’re finding that GA4 or platform reporting gives you conversion numbers that don’t reconcile with sales, if a significant chunk of your revenue happens over the phone or offline, or if you’re trying to build a stronger case for upper funnel or brand investment and need the modelling to back it up.
Pricing
Ruler offers tiered plans based on monthly website visits, starting with a small business plan and scaling up through medium, large, and an advanced tier for higher traffic accounts. Pricing is published on the Ruler Analytics website, and the team can talk you through which tier fits your traffic and reporting needs.
Adobe Analytics
Where the tool shines
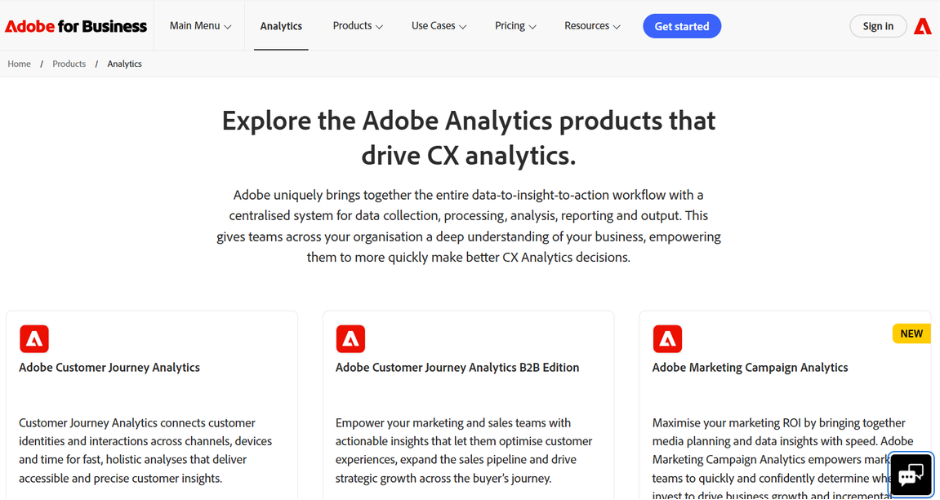
Adobe Analytics is built for large, high traffic, multi brand organisations that need granular governance and want to avoid data sampling. It collects and processes behavioural data in real time from web and mobile channels, converts raw data for analysis to help teams spot patterns and anomalies, and layers in AI capabilities intended to speed up analysis. For enterprises already inside the Adobe Experience Cloud ecosystem, the integration with tools like Adobe Target and Adobe Campaign is a genuine advantage.
Where it falls short
Very small businesses, early stage startups, or teams wanting a simple, low cost, plug and play analytics tool will often find Adobe Analytics too complex and expensive for their needs, and reviewers consistently point to a steep learning curve that usually requires dedicated training and technical resource to get real value from the platform.
Pricing
Adobe uses a custom, quote based pricing model rather than public list prices, structured across Select, Prime, and Ultimate packages, with cost depending on monthly data volume, the number of digital properties, required features, user seats, and contract length. You’ll need to speak to Adobe’s sales team for a proposal.
Amplitude
Where the tool shines
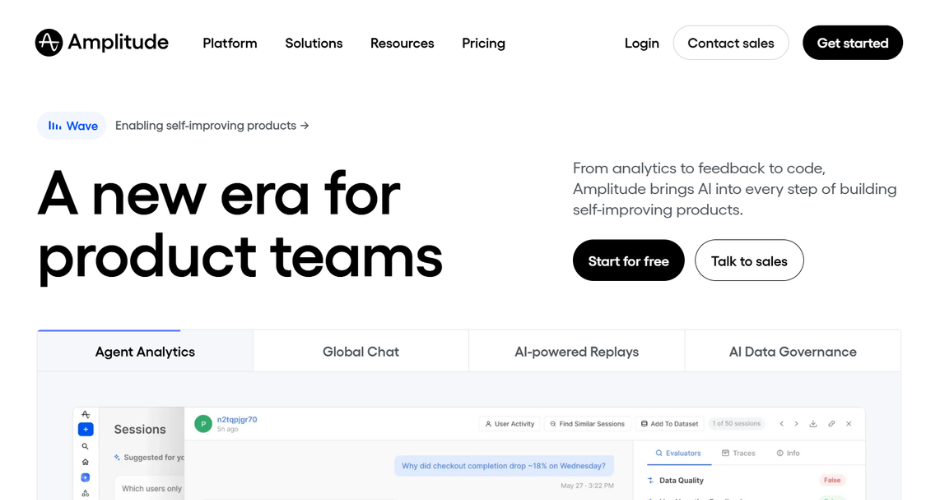
Amplitude is a product analytics platform built for understanding user behaviour inside digital products, going deeper than most web analytics tools that focus on aggregate traffic. It operates at the individual user level, letting teams analyse what people do across a site or app session by session, and all plans include event segmentation, funnel analysis, retention analysis, journeys, data tables, user sessions, and stickiness. Paid tiers add session replay, feature experimentation, guides and surveys, and a suite of AI agents alongside the core analytics.
Where it falls short
If marketing reporting is your primary need rather than in-product behaviour, Amplitude can feel thinner than purpose built marketing analytics tools, and several of the more advanced chart types and behavioural analysis features are locked behind higher tiers, so it’s worth checking exactly what a given plan unlocks before committing.
Pricing
Amplitude offers a free tier for up to 50,000 monthly tracked users, a Plus plan from around $49 a month, and Growth and Enterprise tiers that require a custom quote. Actual spend tends to scale quickly with monthly tracked user volume, so it’s worth modelling your likely usage before you commit to a plan.
Demandbase
Where the tool shines
Demandbase is an account based marketing and go to market platform aimed at B2B companies that want to identify, target, and convert high value accounts. It combines account intelligence, intent data, programmatic advertising, and sales orchestration in one platform, and it’s the only major ABM platform with its own demand side platform for programmatic advertising, supporting account targeted display, LinkedIn integration, and connected TV advertising directly within the platform without needing third party ad tech.
Where it falls short
Published pricing is rarely transparent, and most buyers end up negotiating a custom quote based on their specific requirements, including the number of target accounts, advertising spend, data enrichment needs, and integration complexity. The platform is built for enterprise organisations with dedicated marketing operations and significant advertising budgets, and for most SMB or mid-market teams the pricing and complexity can make it inaccessible.
Pricing
Pricing is custom quoted only, with contracts typically starting around $18,000 a year and a median closer to $65,000 a year, though enterprise deployments with full advertising capabilities can run considerably higher.
DashThis
Where the tool shines
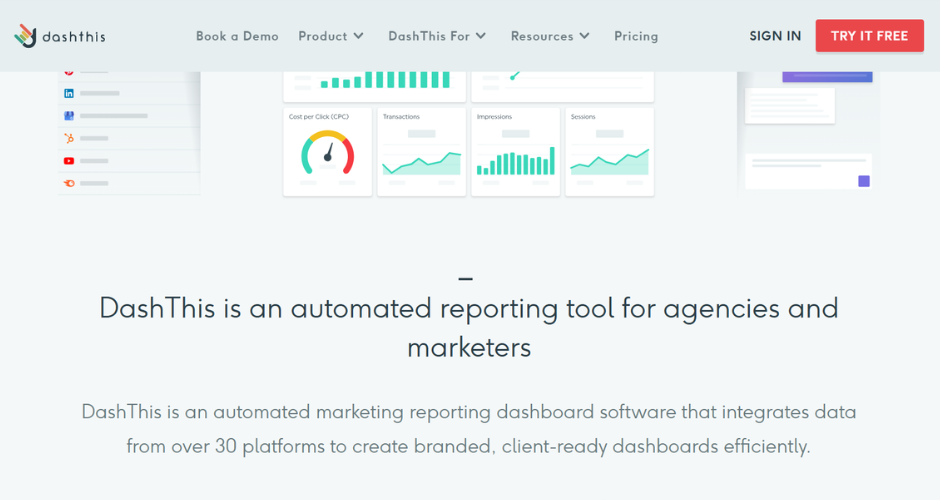
DashThis is a marketing reporting and dashboarding tool built for agencies and marketing teams that need to pull data from multiple channels into a single client friendly view. Core features include customisable dashboards, ad hoc and scheduled reports, data import and export, drag and drop dashboard creation, access controls, and customisable branding. Dashboards can be exported as PDFs and shared with clients by email or link, which makes it a popular choice for agencies producing recurring client reports.
Where it falls short
Pricing is based on the number of dashboards you build rather than users or data connections, and most agencies end up building a dashboard per client, or per client and channel, so costs can grow faster than expected as your client base scales.
Pricing
Plans start at $49 a month for the Individual plan, dropping to around $42 a month billed annually, rising through Professional at $149 a month, Business at $289 a month, and Standard at $449 a month.
Funnel.io
Where the tool shines
Funnel.io is a marketing data platform built to collect, clean, and centralise data from a very wide range of sources. It’s best suited to enterprise marketing operations teams managing 50 or more data source accounts that need centralised governance, and organisations with existing BI infrastructure such as Tableau, Looker, or Power BI that need a reliable marketing data pipeline feeding into their stack.
Where it falls short
Funnel.io’s built in dashboards are fairly basic, and most users end up layering Looker Studio, Tableau, or Power BI on top, which adds both cost and complexity. It also requires meaningful onboarding and data expertise rather than being a plug and play tool, and smaller marketing teams or freelancers are likely to find it costs more per year than their entire tool budget.
Pricing
Funnel’s Starter plan starts at $400 a month, with no free tier, and additional costs scale based on connector usage, destinations, data volume, and reporting granularity, which can make total spend harder to predict as your needs grow.
Google Analytics
Where the tool shines
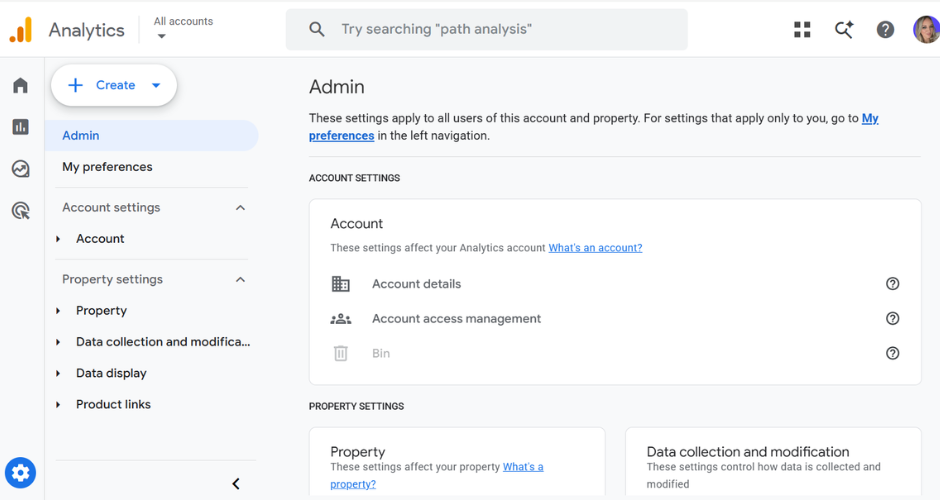
Google Analytics, now delivered as GA4, is the default web analytics tool for the vast majority of marketing teams. In our own research, 90% of respondents said GA4 is their go to marketing tool, which tells you a lot about how embedded it is in the day to day of most marketing teams. It uses an event based data model designed for cross platform measurement and privacy centric data collection, with machine learning powered insights such as predictive metrics and anomaly detection, and the standard version is free, which makes it an easy starting point regardless of budget.
Where it falls short
The free version of GA4 caps you at 500 distinct events per property, 50 custom dimensions, 50 custom metrics, and limits BigQuery export to a million events a day, and reports can be based on a sampled subset of data rather than the full dataset once traffic volumes get high, which can lead to inaccurate conclusions for larger sites. It also remains a session and click based model at heart, which is exactly the kind of last click bias we cover in the pain points above, and it isn’t designed to connect offline conversions or CRM revenue data without additional tooling.
Pricing
The standard version of GA4 is free. The enterprise tier, Google Analytics 360, typically starts around $50,000 a year and adds higher data limits, unsampled reporting, and advanced attribution, though it isn’t available through self serve checkout and pricing is negotiated directly with Google’s sales team or an authorised reseller.
Supermetrics

Where the tool shines
Supermetrics is a data connector tool that automates pulling marketing data out of ad platforms and into a reporting destination of your choice. It connects over 150 channels, including Facebook, Google Ads, and Shopify, and pushes that data into destinations such as Looker Studio, Power BI, Google Sheets, Excel, BigQuery, or Snowflake. A Connector Builder feature launched in 2026 also lets teams build custom integrations for platforms that aren’t natively supported.
Where it falls short
Supermetrics charges separately for each data source, which can create expensive bills for teams pulling from multiple platforms, and destinations are charged separately too, so sending data to more than one reporting tool adds further cost. It’s also a connector rather than a full reporting or attribution tool, so most teams pair it with a separate visualisation or dashboarding platform.
Pricing
Plans start at around $29 a month for a single connector, rising to $159 a month for the Core plan, with additional data sources starting from around $37 a month each and extra destinations priced separately on top.
Book a demo and see your own performance data differently
Every tool on this list solves a real problem, and for a lot of teams, the right answer is a combination rather than a single platform. But if the pain points at the start of this article sound familiar, that’s usually a sign your current stack is telling you what happened rather than why it happened, or what to do next.
From what we’ve found from conversations with marketers who’ve made the switch, the biggest shift usually isn’t a new dashboard, it’s finally being able to trace a sale back to the campaign, keyword, or piece of upper funnel activity that actually influenced it, offline conversions included.
Ruler was built specifically to close that loop, connecting first party tracking and multi touch attribution with marketing mix modelling and budget scenario planning, so you’re making decisions based on predicted outcomes rather than last click guesswork.
If you’d like to see how that looks against your own marketing data, book a demo with Ruler Analytics and we’ll show you exactly where your budget could work harder.