We’ve helped a lot of marketers measure Facebook, and the same issue comes up: GA4 gives an incomplete view. We cover the standard GA4 setup, plus a broader measurement approach we recommend for a more accurate picture.
Facebook advertising is genuinely difficult to measure well. The platform’s own reporting has gaps.
GA4 fills some of them but creates new ones. And the downstream pressure to justify spend, to someone, whether that’s a board, a client, or just yourself at the end of a quarter, doesn’t get easier when your numbers contradict each other.
We’ve dealt with this ourselves and while working closely with clients. This guide is what we’ve landed on as a working approach.
Here’s what we’ll cover:
- Why we think connecting Facebook to GA4 still matters
- How to set up UTM tracking so Facebook traffic stops disappearing
- Where we see GA4 fall short for Facebook measurement
- How we track the performance of ad performance
💡 Pro Tip
GA4 can’t track individual users back to revenue, missing multi-touch attribution models and cuts lookback window off after 90 days, and is completely blind to the ad impressions that drive most upper-funnel Facebook performance.
For campaigns built around awareness rather than immediate clicks, that combination of gaps means GA4 will consistently undervalue what Facebook is actually contributing.
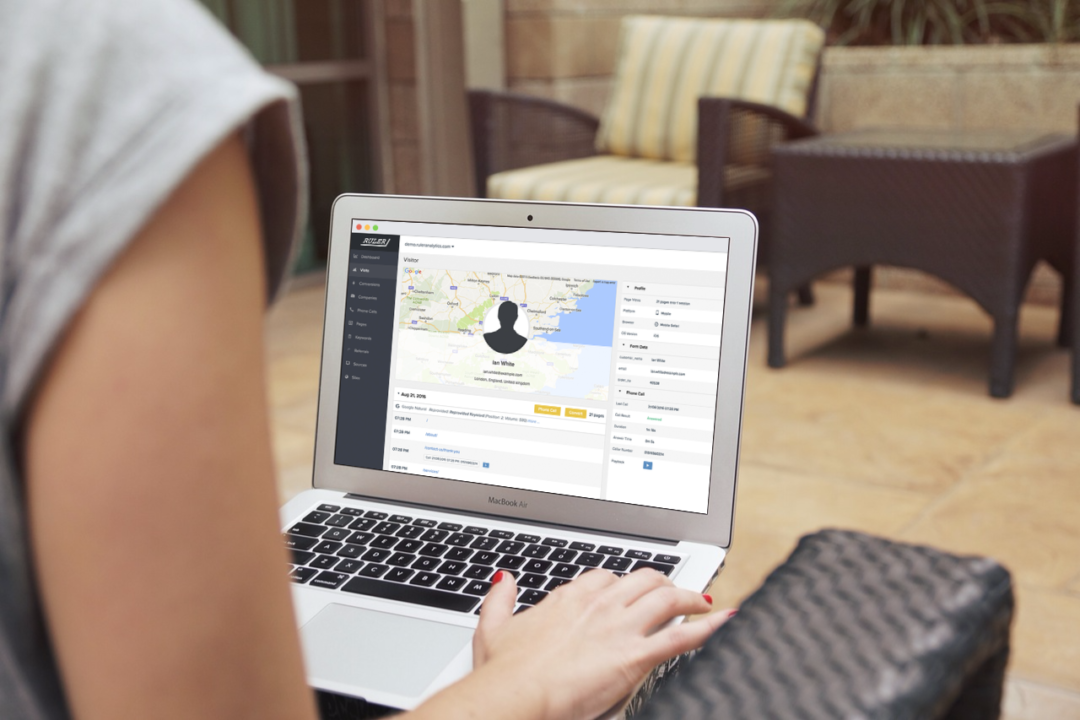
Ruler Analytics is built to close those gaps. It tracks full click-path journeys for every conversion, passes offline and revenue signals back to Meta so the algorithm has something meaningful to optimise against, and combines first-party attribution with MMM in a single platform, so you can answer both “which campaign drove this lead” and “what is Facebook actually worth to our business” from one place.
Book a demo with Ruler Analytics
Why connect Facebook to Google Analytics 4?
Facebook’s own reporting tells you reach, clicks, and platform-side conversions. That’s important, but it stops the moment someone leaves Facebook and lands on your website.
What happens after the click? How long do those visitors actually stay? Are they engaging with anything, or bouncing immediately? Are the people clicking on your ads the same people who eventually become customers? Facebook Ads Manager can’t answer those questions. GA4 can give you website engagement metrics, at least partially.
There’s a practical reason too. Following Apple’s iOS changes, advertisers have seen significant reductions in conversion reporting inside Facebook Ads Manager. GA4 captures that data independently, giving you a second source to sense-check Facebook’s numbers against.
Connecting them won’t solve everything, but it gives you a place to start, we’ll get into that shortly.
How to track Facebook Ads in Google Analytics 4
Without some setup, Facebook traffic gets lost. It typically surfaces as Direct or Unassigned in GA4, which makes it impossible to evaluate separately from everything else. The fix is UTM parameters, small tags added to the end of your URLs that carry source information directly into GA4.
Here are the four steps.
Step 1. Build your tracking URL in Google’s Campaign URL Builder
Head to Google’s Campaign URL Builder. You’ll need to fill in four fields.
Your destination URL is wherever you want the ad to send people, a landing page, a product page, your homepage. The campaign source should be “facebook” in lowercase. UTM parameters are case-sensitive, so consistent lowercase across all your tags keeps your GA4 data clean and avoids duplicate source entries.
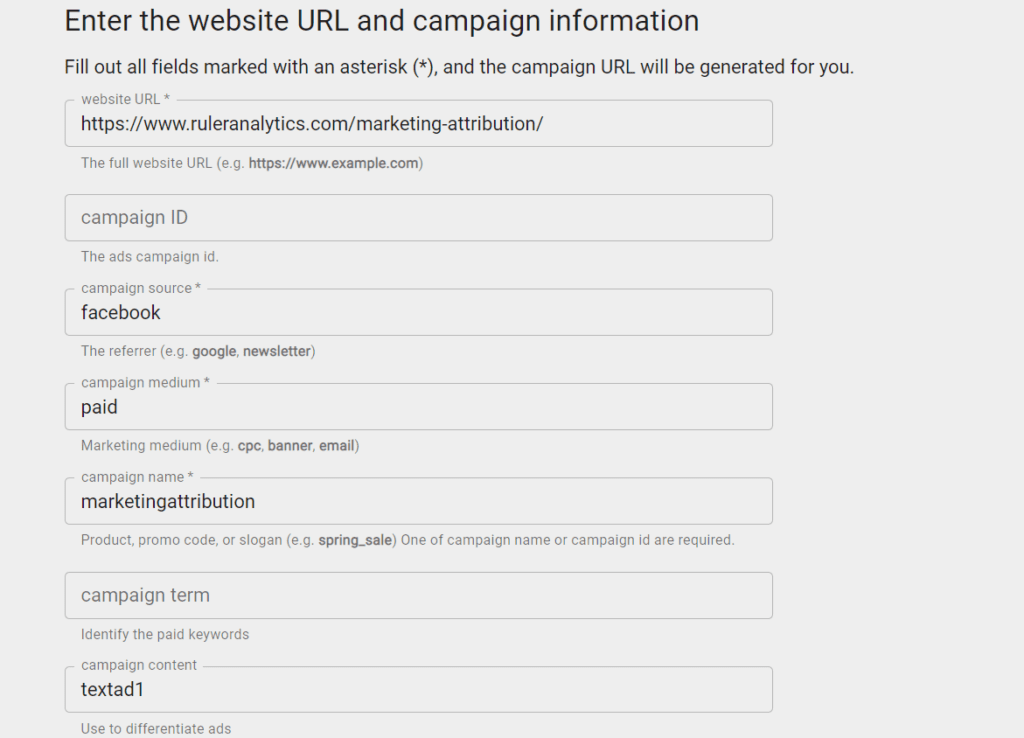
The campaign medium should be “paid.” Don’t use “cpc” here. That convention is for paid search, and using it for Facebook will fold your social traffic into your Google Ads data, which makes both harder to analyse.
Related: Why GA4 and ad platform data don’t match and what to do
The campaign name should match whatever you’re calling this campaign internally. Keeping it consistent with your Facebook Ads Manager naming makes it easier to cross-reference the two platforms.
If you’re running multiple ad variations within the same campaign, the optional “content” field is useful for telling them apart, “video-v1” versus “image-v2,” for instance. That granularity can matter when you’re trying to understand creative performance beyond platform-side metrics.
Once the fields are filled, the builder generates your tagged URL.
💡Pro Tip
Tracking social media channels like Meta and TikTok can be tricky, and relying solely on Google Analytics 4 won’t give you the full picture for measuring ad impact and making budget decisions. To get a clearer view of what’s actually working, it’s best to use a mix of methods, like first-party MTA, MMM, and incrementality. Our measurement framework shows how they all come together.
Tap here to check out the framework for a better breakdown
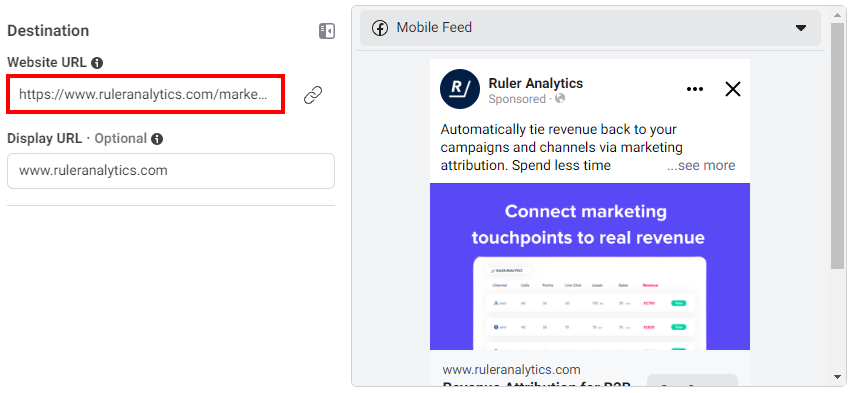
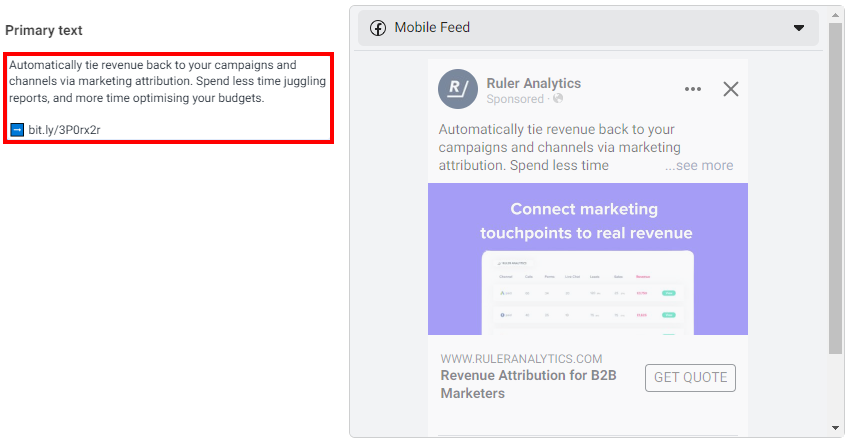
Step 2. Add the trackable link to your Facebook ad
There are two ways to do this. The most common is to paste your tagged URL directly into the Website URL field when setting up your ad in Ads Manager.
The alternative is to include it in your ad copy, shortened via a tool like Bitly. This keeps the link cleaner visually and works well for placements where a long URL looks unwieldy.
Step 3. View your Facebook performance in GA4
Once your tagged links are live, GA4 picks up the data automatically. Go to Reporting, then Acquisition, then Traffic Acquisition. Change the dimension in the drop-down to session source, session medium, or session campaign to see Facebook broken out from your other channels.
For more detailed analysis, Explorations gives you access to cohort analysis, funnel reports, path analysis, and user behaviour breakdowns.
These are worth building out if you want to understand not just how many people Facebook is sending, but what those people actually do after they arrive.
Where we believe GA4 doesn’t fully capture Facebook’s impact
This is the part most GA4 and Facebook tracking guides gloss over.
Individual user journeys are invisible. GA4 anonymises all visitor data by design. You can see how many people clicked a Facebook ad and landed on your site. You cannot see where those specific people went afterwards, whether they became leads, whether they converted, whether they’re in your CRM right now. The anonymity is necessary and correct from a privacy standpoint. But it means GA4 can never answer the question of whether your Facebook spend is actually generating revenue.
Related: How to track users in Google Analytics 4—what it misses and what we use instead
The attribution models don’t capture multi-touch journeys well. GA4 offers last-click and data-driven attribution. Last-click tends to over-credit the final channel before conversion, which is almost always branded search or direct, and says nothing about what came before. Data-driven is more sophisticated but operates without transparency into how credit is actually distributed. Both models also cut off at 90 days. For any business where customers take longer than that to make a decision, a meaningful portion of Facebook-influenced conversions will be misattributed entirely.
Impressions don’t exist in GA4’s world. GA4 tracks clicks. It has no mechanism to model impressions, which matters enormously for upper-funnel Facebook campaigns that are designed to build awareness rather than drive immediate action. Someone who sees your Facebook ad three times over two weeks, searches for you by name, and converts through organic search looks like a purely organic conversion in GA4. Facebook gets no credit. Multiply that across your entire audience and you’re systematically undervaluing the channel.
Related: How to measure top of the funnel marketing and brand awareness
Meta’s own view-through attribution attempts to address this, but its 24-hour window is too short for most B2B or considered purchase cycles, and its reliance on third-party cookies makes it increasingly unreliable.
What our data actually showed us about Facebook’s impact
Here’s where we want to share something concrete, because this changes how we think about Facebook measurement more than anything else.
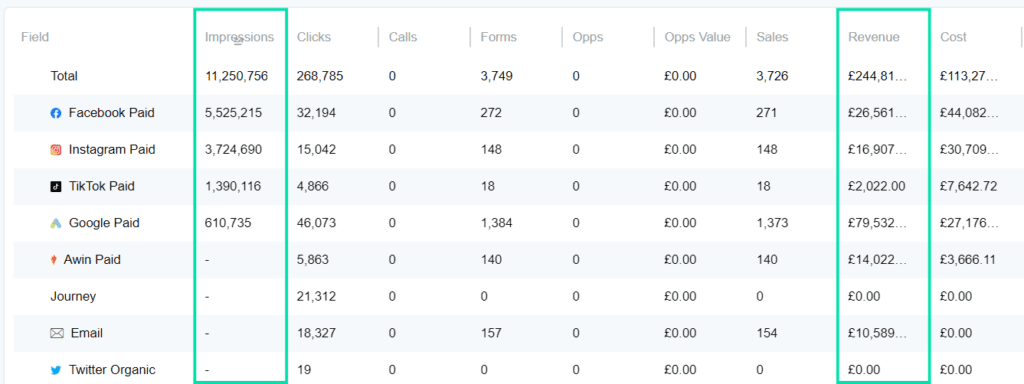
When we looked at Facebook Prospecting performance through last-click attribution, the model used in GA4, the ROAS was zero. The kind of number that triggers a conversation about whether to cut the budget entirely.
When we ran marketing mix modelling alongside it, the picture was completely different.
| Channel | Last Click ROAS | Data-Driven ROAS | MMM ROAS | MMM Marginal ROAS |
| TikTok Prospecting | 0 | 2.86 | 2.1 | 1.4 |
| Facebook Prospecting | 0 | 2.55 | 4.1 | 2.6 |
| Instagram Prospecting | 0 | 2.35 | 2.3 | 1.2 |
| Google Pmax | 0.6 | 0.87 | 2.3 | 0.9 |
| Google Non Brand | 0.4 | 0.8 | 1.2 | 0.4 |
Facebook Prospecting came in at a 4.1x MMM ROAS and a marginal ROAS of 2.6. That’s a strong positive return on a channel that last-click said was contributing nothing.
The gap exists because MMM captures what click-based attribution misses, the contribution of impressions, upper-funnel exposure, and brand-building activity that influences conversions happening later through other channels.
Facebook Prospecting, almost by definition, operates at the top of the funnel. Of course last-click undersells it.
In several cases, this kind of data has stopped teams from cutting budget based on incomplete measurement.
How we track Facebook beyond GA4
UTM parameters give you click data. MMM gives you a macro view of channel contribution. There’s a layer in between that’s also worth having, individual lead and revenue attribution.
First-party attribution for click-path tracking
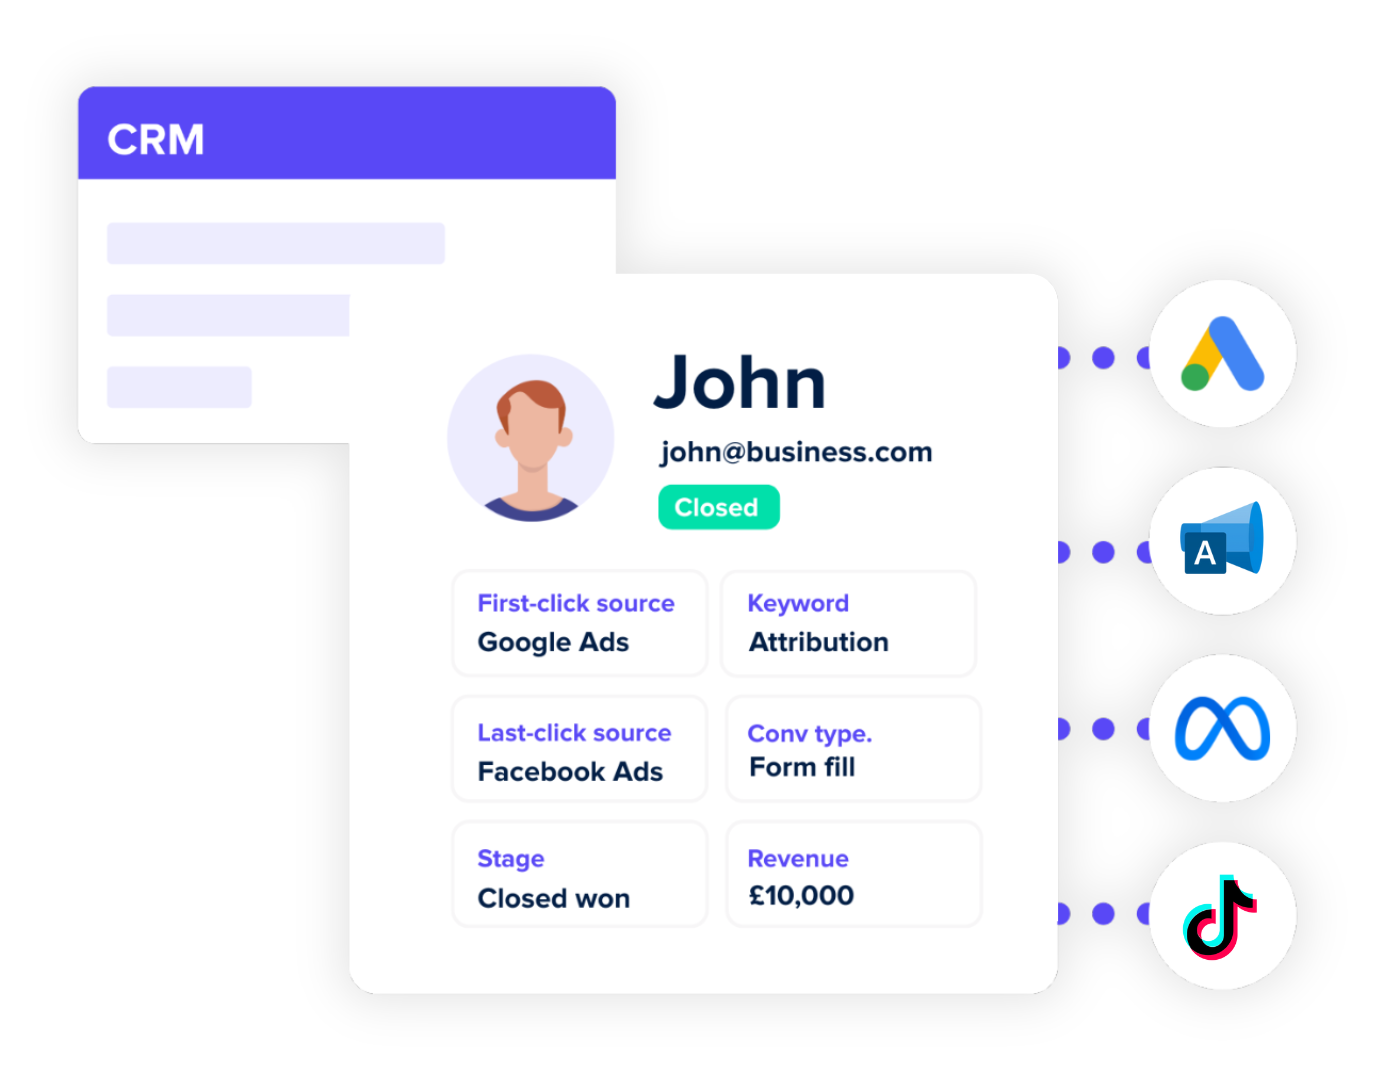
We use Ruler to track every website visitor across multiple sessions and touchpoints, regardless of whether they’re logged in. When a visitor converts into a lead, via a form, phone call, or live chat, Ruler connects that conversion to all the marketing touchpoints that came before it, including the Facebook campaign that started the journey via first-party identifiers.
The click path is the part that matters most in practice. If last-click attribution points to Direct or organic search, that’s normally where GA4’s story ends.
With Ruler, you can see a Google and Facebook ad click and then a organic search that finally closed it.
Ruler captures FBCLID and GCLID using first-party cookies and passes the marketing source data through to your CRM automatically.
That means your sales team can see where every lead came from, and you can track those leads as they move through pipeline stages rather than losing sight of them the moment they leave your website.
Related: 4 steps to create a first-party data strategy
When a deal closes, whether that’s a week later or a year later, the revenue gets sent back to Ruler and attributed to the contributing touchpoints. Unlike GA4’s 90-day cap, there’s no lookback limit.
Closing the loop with Meta
Ruler integrates directly with Facebook. We can send MQL, opportunity, and closed-revenue data from our CRM back into Meta Ads Manager as conversion signals.
This does two things. It improves reporting, Meta can see what those clicks actually produced downstream, not just that they happened. Second, it gives the algorithm stronger signals for optimisation.
Related: First-party data activation—smarter path to better ad targeting
For longer sales cycles this matters a lot. If you’re waiting six months for a deal to close before sending any revenue signal back to Meta, the algorithm is making targeting decisions with very little to go on.
Sending signals at earlier funnel stages, when a lead becomes a qualified opportunity, for instance, means Meta has something meaningful to work with without waiting for the full cycle to complete.
Impression modelling for what clicks miss
Even with strong click-path tracking in place, there’s still a gap. Someone who sees your Facebook ad, doesn’t click, and converts weeks later through a direct visit is invisible to click-based attribution.
Related: The future of measurement—the role of impression attribution
Ruler’s impression attribution uses a Bayesian machine learning model and Shapley values to match ad views to eventual conversions and revenue, without relying on cookies or personally identifiable information. So as third-party cookies continue to diminish, it holds up.
Marketing mix modelling for budget planning
First-party tracking handles individual view-through journeys. MMM operates at a different level entirely, it looks at your business outcomes as a whole and works backwards statistically to understand which marketing inputs drove them.
Every channel goes into the model, digital or otherwise. TV, out-of-home, sponsorships, print, they sit alongside Facebook, Google, and paid social in a single unified view of channel contribution that no click-based tool can produce.
For Facebook prospecting specifically, this is where MMM earns its keep. People see the ad, they don’t click, but hey come back later through a different route.
MMM captures the contribution of that exposure and, crucially, tells you what would happen if you spent more or less on the channel.
It generates diminishing return curves that show exactly where each channel sits on the spectrum between headroom and ceiling. Some channels still have room to scale and will respond proportionally to increased spend.
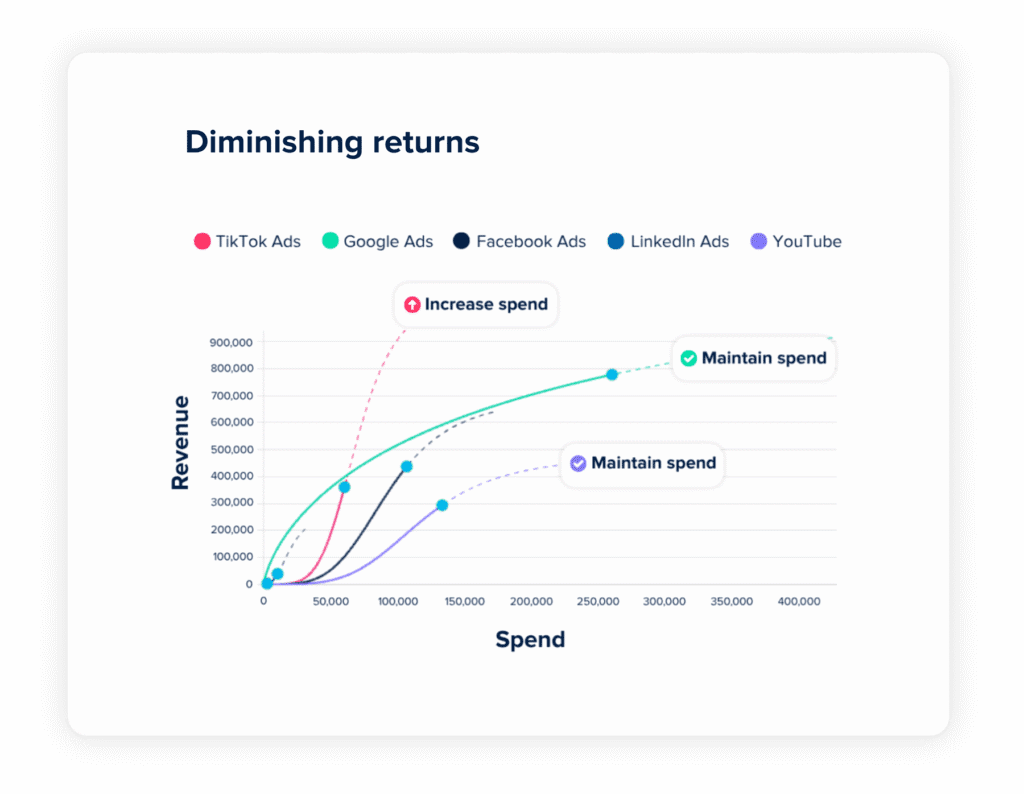
Others have plateaued, and pushing more budget in produces diminishing returns.
Without this view, the instinct is to follow last-click data, which, as the benchmark table above shows, pointed at Facebook Prospecting as contributing zero while MMM showed a 4.1x return.
Qualitative data as a cross-check
We also ask. A “how did you hear about us” field in our forms, questions on discovery calls, the occasional customer survey. Self-reported attribution is imperfect, customers don’t always remember accurately, and we’ve found roughly 56% of self-reported answers end up being too vague to act on.
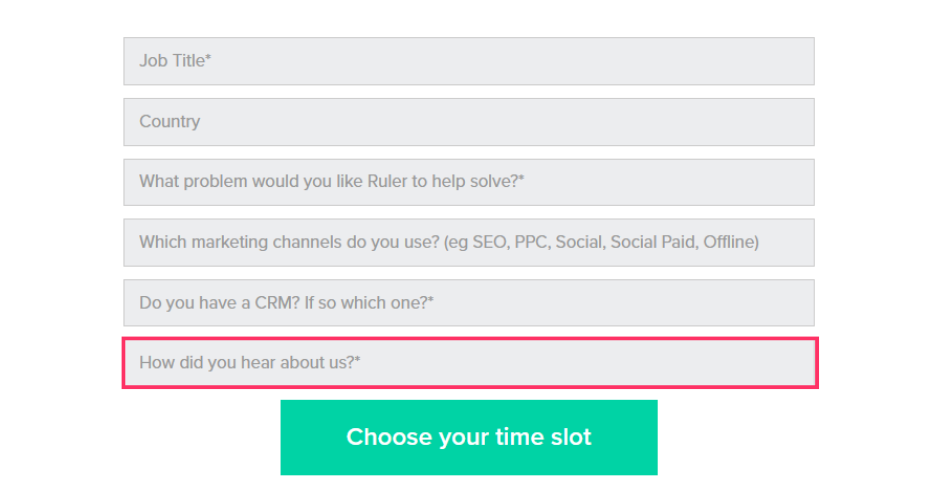
But it surfaces things that no tracking system captures, like referrals, word of mouth, and dark social. It’s a useful cross-check rather than a primary measurement method.
Incrementality testing to validate everything
The most rigorous way to answer whether Facebook is actually driving incremental revenue, rather than just being present when revenue happens, is to run a proper incrementality test.
Divide your audience into a treatment group that sees the campaign and a control group that doesn’t.
Compare their behaviour. Any meaningful difference in conversions or revenue can be attributed directly to the campaign rather than to background noise.
Incrementality is particularly valuable for validating MMM outputs.
MMM is excellent for spotting trends and modelling long-term channel contribution. Incrementality testing sharpens that picture by identifying what’s genuinely causing results rather than correlating alongside them. Used together, they’re the most reliable way to make budget decisions.
We can help you go beyond GA4 Facebook tracking
Set up UTM tracking. That’s the baseline. Without it, Facebook traffic disappears into Direct and you’re working with less information than you need.
However, don’t let GA4 be the only lens you use to evaluate Facebook. It will systematically undervalue upper-funnel activity, cut off attribution at 90 days, and tell you nothing about what happened to your leads after they converted.
Our own data showed Facebook Prospecting at a 4.1x MMM ROAS while last-click reported zero. That’s not a marginal discrepancy, that’s a different conclusion entirely.
If you’re spending on Facebook but don’t fully trust what GA4 or platform data is telling you, it’s worth exploring a unified measurement approach for a more accurate view of performance. You can start by booking a demo with Ruler Analytics.
Facebook & GA4 FAQs
When someone clicks a link inside the Facebook mobile app, it often opens in an in-app browser rather than the user’s regular browser. That transition breaks the referral chain, and GA4 records the visit as Direct rather than attributing it to Facebook. Adding UTM parameters to your Facebook ad URLs bypasses this, the source information is embedded in the URL itself, so it doesn’t rely on the referrer header being passed correctly.
Use “paid” for Facebook ads. Avoid “cpc”. That convention is for paid search and will fold your Facebook traffic into your Google Ads data in GA4, making both harder to analyse. Using “paid” keeps social and search clearly separated.
Apple’s App Tracking Transparency framework limits the data Facebook can collect on iOS users who opt out. This means conversions from iOS users are underreported in Facebook Ads Manager, some estimates put the reduction at up to 40% of reported conversions. GA4 captures data independently via your website rather than relying on Facebook’s pixel, which makes it a useful second source for sense-checking Facebook’s numbers. That said, GA4 also has its own limitations with Apple’s Intelligent Tracking Prevention, which restricts cookies to seven days.
Meta’s view-through attribution gives credit to an ad impression if a user converts within 24 hours of seeing it. That window is too short for most considered purchase cycles, and it depends on third-party cookies that are becoming increasingly unreliable. Ruler’s impression attribution uses a machine learning model to match ad views to conversions and revenue over a longer window, without relying on cookies or PII. It’s more durable and captures a more realistic picture of how upper-funnel impressions influence eventual conversions.
Both, ideally. MMM is excellent for understanding long-term channel contribution and modelling budget scenarios, it captures the macro influence of Facebook across your entire marketing mix. Incrementality testing isolates the causal impact of a specific campaign, cutting through correlation to show what’s genuinely driving results. They answer different questions and validate each other. If you can only do one, MMM gives you a broader and more actionable view of Facebook’s contribution to revenue.