Track performance and gain powerful insights about your campaigns with these digital marketing reporting tools.
Measuring your marketing is essential for understanding what’s actually driving growth and where the budget is best spent. But with so many reporting tools available, choosing the right one can feel like a project in itself.
We compiled this list from conversations with marketers, cross-referenced against reviews, forums and case studies. The patterns in how teams use these tools, and where they run into problems, were consistent enough to be worth documenting.”
In this article, we’ll cover:
- What is a digital marketing reporting tool?
- The different types of digital marketing reporting tools
- The best digital marketing reporting tools compared
Key takeaways
Effective marketing reporting requires tools that track, measure and connect marketing activity to tangible results, not just traffic and conversions, but actual pipeline and revenue.
Our list was built from real-world conversations with marketers and patterns we’ve seen across reviews, with a focus on the features that determine each platform’s effectiveness for different needs.
We cover marketing reporting tools, outlining key advantages, limitations, best-fit scenarios and pricing considerations.
Tools vary significantly by focus. Some excel at web traffic analysis, others at product analytics, data visualisation or cross-channel reporting.
Where most tools stop at conversions, Ruler closes the loop, using deterministic tracking to connect every touchpoint to closed revenue, and probabilistic modelling to estimate the impact from channels that don’t generate a direct click, so you get a complete picture of how everything’s working together to drive pipeline.
What is a digital marketing reporting tool?
A digital marketing reporting tool lets you report, measure and present your marketing performance across key metrics such as clicks, leads, revenue and ROI.
Most marketers need two things, understanding what’s working and justifying where the budget goes.
Reporting tools are how both of these things get done.
The better ones allow you to collect data from multiple sources (paid, organic, email, social) into a single view, turn that data into decisions, and track which channels are actually generating conversions, not just traffic.
The different types of digital marketing reporting tools
Not every tool does the same job. The most common categories are:
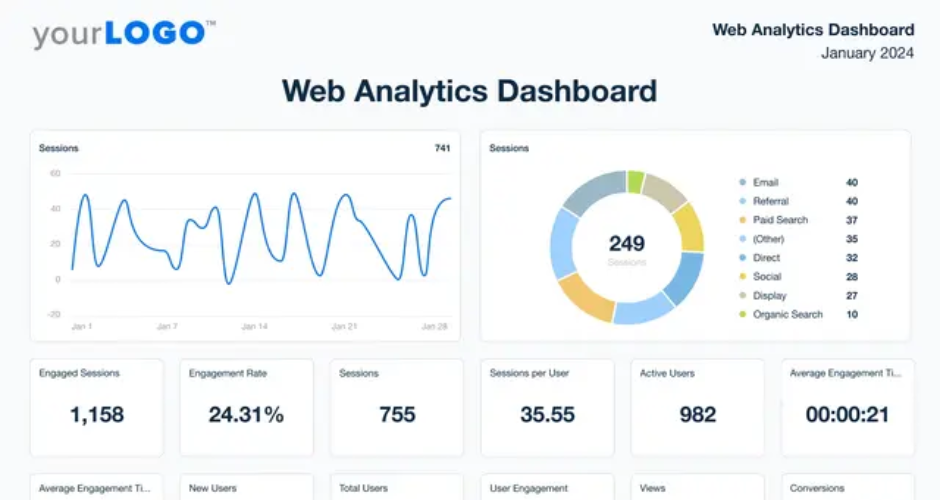
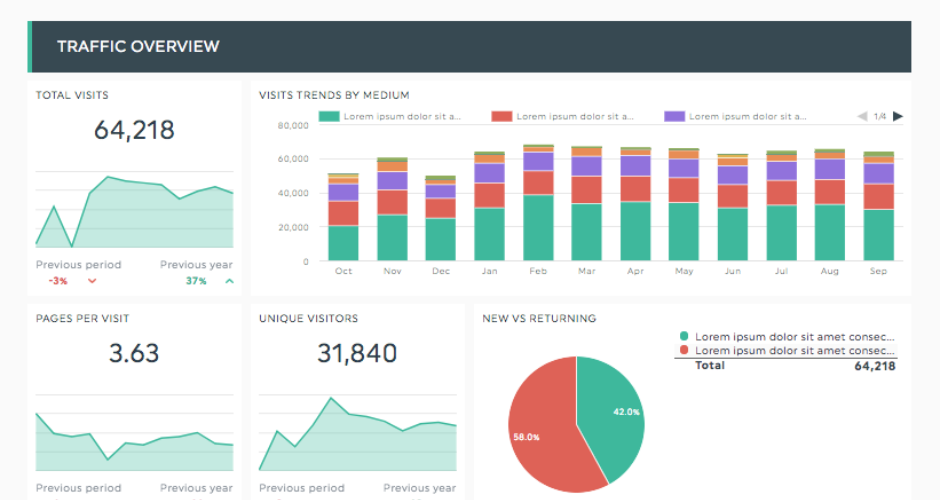
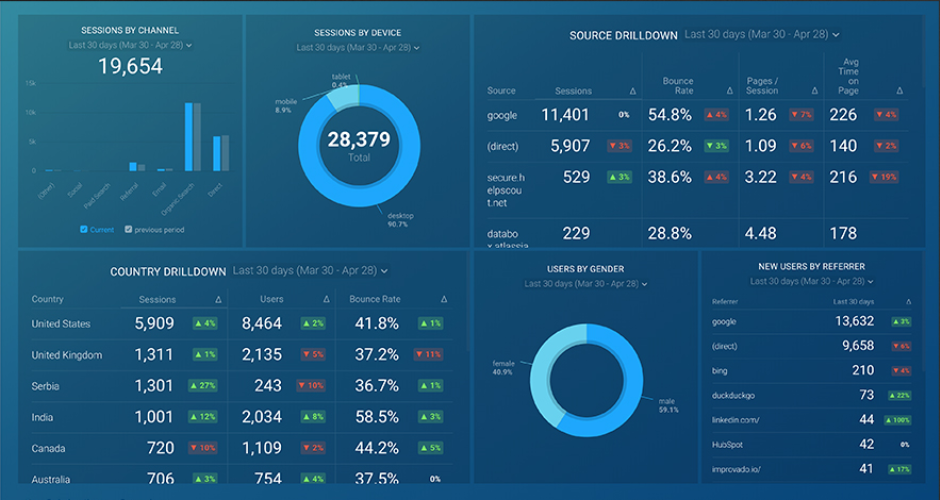
Marketing analytics software tracks user behaviour on your website, how visitors arrive and what they do once they get there.
Marketing attribution software goes a step further. It shows which channels and campaigns are driving your highest-converting leads and the most revenue, not just visits.
Business intelligence software is built for broader organisational analysis, giving managers and executives a way to collect, store and act on data across the business.
Data visualisation software focuses on how data is presented, charts, tables, dashboards, to make it easier to communicate performance to teams and stakeholders.
Digital marketing reporting tools compared for 2026
Through conversations with marketers and patterns we’ve seen across reviews, we’ve put together this list of 11 tools spanning attribution, analytics, data visualisation and business intelligence.
- Ruler Analytics
- AgencyAnalytics
- DashThis
- Databox
- Google Analytics
- Klipfolio
- Mixpanel
- Tableau
- TapClicks
- Two Minute Reports
- Whatagraph
Ruler Analytics
To be upfront, this is our platform, but it was built from shortcomings we kept seeing in other marketing reporting tools.
What we designed it to solve
Most marketing reporting tools stop at conversions. Ruler was built to go further, tracking the complete journey from anonymous visitor to closed revenue. It captures every touchpoint (web visits, form fills, phone calls, live chats) at the visitor level using first-party tracking. When someone converts into a lead, Ruler matches their contact details to their full journey and sends that data into your CRM. When they become a customer, the revenue data flows back into Ruler so you can see exactly which campaigns influenced that deal.
Where we see it work best
We see the strongest results with companies that have sales cycles longer than 30 days and need to demonstrate marketing’s impact on pipeline and revenue. It’s also a strong fit for ecommerce businesses with high-value repeat purchases that want to track lifetime value by channel.
For teams running upper-funnel campaigns that don’t generate immediate clicks, display ads, social awareness, Ruler uses a hybrid attribution model combining click-based tracking with impression modelling informed by marketing mix modelling. The result is that channels like social and display get proper credit, rather than having all conversions attributed to bottom-funnel branded search.
To give a sense of what that looks like in practice, one marketing team running Google non-brand search alongside Meta prospecting saw last-click data suggest Google was driving the majority of new business while Meta looked hard to justify. Impression modelling through Ruler told a different story, Google was near saturation, while Meta was driving awareness and incremental conversions upstream. Shifting budget accordingly changed the picture significantly.
An agency working with an ecommerce client spending around £200,000 on paid media used Ruler’s multi-touch attribution and closed-loop framework to connect buyer journeys to their CRM and feed that data back into Google Ads. Based on those insights, an additional six figures of monthly revenue was attributed to PPC campaigns, with further optimisation producing a 127% increase in ROAS.
Consider Ruler if
- You need to attribute closed revenue, not just leads or conversions
- Your sales cycle is longer than ad platforms or GA4 can reliably handle
- You want to track offline conversions such as calls, meetings or in-person events
- You’d prefer first-party tracking that doesn’t rely on third-party cookies
- You need to prove marketing ROI to executives or clients
- You want to allocate budget more effectively across all channels, including upper-funnel
- You need forecasting insights to predict future pipeline and revenue based on marketing activity
Pricing
Starts at £199/month for small businesses (up to 50,000 monthly visits), scaling to £649/month for mid-market and £1,149/month for enterprise. Custom pricing available for 200,000+ monthly visits.
💡 Pro Tip: Want more information on Ruler and the services we offer? Book a demo to see Ruler in action and learn how it can help evidence your marketing’s impact on revenue.
Book a demo of Ruler
AgencyAnalytics
What we’ve seen it do well
AgencyAnalytics is built specifically for marketing agencies and it shows in how the product is structured. It connects data from multiple sources, SEO, PPC, social, email, call tracking and ecommerce, and surfaces it in white-labelled dashboards and automated reports that can be shared directly with clients. The drag-and-drop builder is genuinely fast to work with, and the bulk operations feature lets agencies replicate and update report templates across multiple client accounts without rebuilding from scratch. Teams consistently flag the customer support as a standout, with one-to-one chat responses from real people rather than automated replies.
Where it falls short
The platform is designed for reporting, not analysis. Users who want to go beyond standard metrics run into walls fairly quickly, custom dimensions, advanced segmentation and data blending are either limited or locked behind higher-tier plans. The dashboards have also been described as template-bound; if client reporting needs are complex or highly bespoke, the layout options become restrictive. Pricing scales per client campaign, which catches some agencies off guard as the account list grows.
Consider AgencyAnalytics if
You’re an agency managing multiple client accounts and need clean, professional, automated reporting without a heavy technical setup. It’s a strong fit for teams that are moving away from manual reporting and need something that looks polished out of the box.
Pricing
Plans start at $79/month with a five-client minimum. Pricing scales per client campaign beyond that. 14-day free trial, no card required.
DashThis
What we’ve seen it do well
DashThis automates the process of pulling data from multiple sources into a single client-facing report. The setup is straightforward, the interface is easy to use without technical knowledge, and the white-label options let agencies present reports under their own branding. With many native integrations covering the main paid and organic channels, it handles standard monthly reporting efficiently. Customer support is frequently cited as responsive and practical.
Where it falls short
The pricing model is based on the number of dashboards, which can become costly quickly for agencies managing multiple clients across multiple report types. Data blending is limited, combining metrics from different platforms into a single view requires workarounds. There’s no custom API, so any data outside the native integrations has to come in via CSV upload. Reports have also been described as visually dated compared to more recent tools, and advanced filtering and calculated fields aren’t available.
Consider DashThis if
You’re a freelancer or small agency that needs to automate straightforward monthly reporting across a manageable number of clients. It’s a practical step up from manual spreadsheet reporting at a lower price point than most agency-focused alternatives.
Pricing
Individual from $33/month, Professional from $109/month, Business from $209/month, Standard from $339/month. All plans include unlimited users.
Databox
What we’ve seen it do well
Databox connects to tons of data sources and aggregates them into a clean, customisable dashboard. It’s well-regarded for its real-time alert system, which flags anomalies and metric changes without requiring manual monitoring. The mobile-first design means dashboards are accessible on the go, and the free tier, which includes three data source connections and 60+ integrations, makes it easy to trial before committing to a paid plan. Teams managing internal KPI tracking across marketing and sales in one view tend to find it a practical fit.
Where it falls short
Cost scales with data source connections rather than users, which means adding more platforms can push the bill up faster than expected. AI features and higher-frequency data refreshes are locked to the Growth and Premium tiers. Dashboard limits on lower plans have been a recurring frustration for data-heavy users, and some reviewers note that connector reliability can be inconsistent, dashboards occasionally fail to update without manual intervention.
Consider Databox if
You need a centralised view of marketing and business performance across multiple platforms, and you want something that’s quick to set up without needing a data analyst. The free plan is worth testing to understand whether the depth of reporting meets your needs before paying.
Pricing
Free plan available. Paid plans from $159/month, scaling with data source connections. Extra connections cost approximately $5.60/month each beyond the plan allowance.
Google Analytics
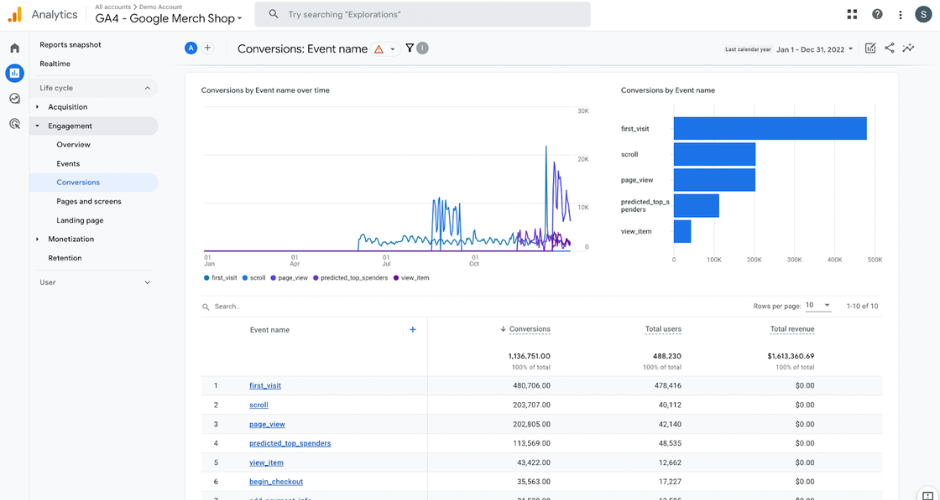
What we’ve seen it do well
Google Analytics remains the most widely deployed web analytics tool on this list. It tracks how visitors arrive at a website, how they behave once they’re there, and where they drop off, providing a foundation of traffic and conversion data that most reporting setups build from. The integration with Google Ads and Search Console makes it a natural starting point for teams running paid and organic search, and the event-based tracking model in GA4 offers meaningful flexibility for teams that want to go beyond pageview-level reporting.
Where it falls short
Direct traffic misattribution is a persistent issue, sessions that can’t be tied to a specific source get bucketed into direct, which tends to inflate that channel’s apparent contribution. GA4 also stops at conversions. Connecting those conversions to actual revenue requires either significant additional configuration or a separate tool. For teams with longer sales cycles or offline conversion activity, the gap between what GA4 reports and what’s actually happening in the pipeline can be significant.
Pricing
The standard version is free. GA360 (enterprise) uses tier-based pricing and can run up to £150,000/year.
Klipfolio
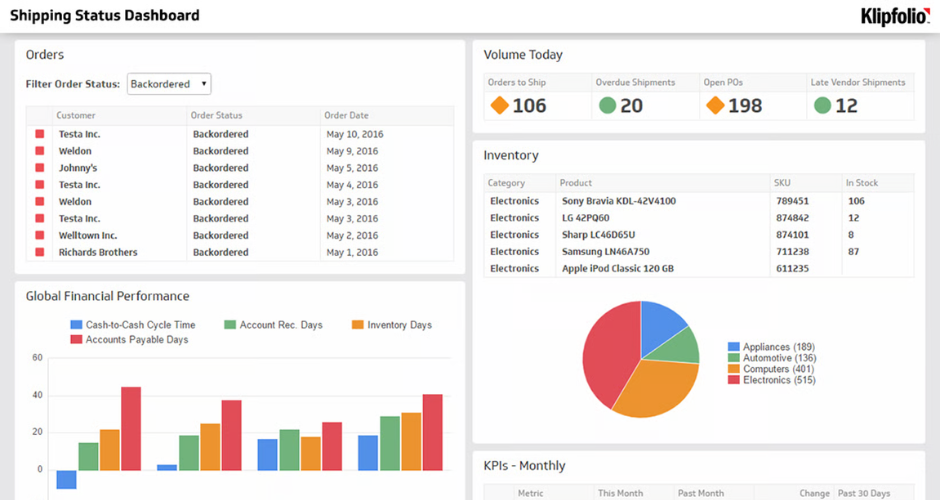
What we’ve seen it do well
Klipfolio gives teams a high degree of control over how data is visualised. It connects to many platforms and supports data blending, combining sources into a single view, along with custom metrics built using formula fields. For teams with analytical capability who want to build tailored dashboards rather than rely on templates, it offers more flexibility than most tools in this category. The AI insights feature automatically surfaces performance changes and patterns, which can reduce the time spent hunting for anomalies manually.
Where it falls short
That flexibility comes with a setup cost. Klipfolio is closer to a BI tool than a marketing dashboard, which means getting value from it requires more technical effort than tools designed for non-technical users. There are no ready-to-go report templates, dashboards need to be built manually, which becomes time-consuming at scale. The basic plan limits users to five dashboards, and the CSV file upload cap is a constraint for teams working with larger data exports.
Consider Klipfolio if
You have a team member who’s comfortable working with data and wants a highly customisable reporting environment without an enterprise price tag. Less suited to agencies running high volumes of client reports where speed of setup matters.
Pricing
Freemium plan available. Business plans from $90/month. Agency plans from $110/month, scaling up to $1,025/month for the Premier tier.
Mixpanel
What we’ve seen it do well
Mixpanel is built around event-based tracking, which makes it well-suited to understanding what users do inside a product, not just how they arrived. Feature activation, retention rates, funnel analysis and A/B testing are all areas where it outperforms general-purpose analytics tools. For product teams that need to understand how different cohorts engage with specific parts of an application, the depth of behavioural data is a genuine differentiator.
Where it falls short
It’s not a marketing attribution or campaign reporting tool. Mixpanel doesn’t connect marketing spend to revenue, and its reporting interface is oriented around product events rather than channel performance. Teams looking to understand which campaigns drove acquisition, and what those leads were worth, will need a separate tool.
Consider Mixpanel if
You’re a product-led team that needs detailed behavioural analytics post-acquisition. It works well alongside marketing reporting tools rather than as a replacement for them.
Pricing
Free plan includes up to 1 million monthly events. Paid plans from $25/month.
Tableau
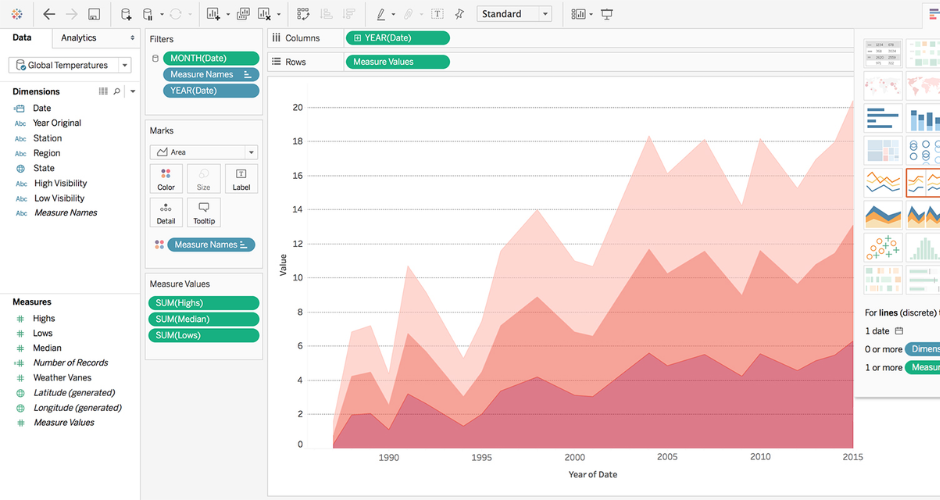
What we’ve seen it do well
Tableau is one of the most capable data visualisation platforms available. It handles large, complex datasets and can produce interactive dashboards with statistical analysis, trend lines, forecasting and clustering, capabilities that go well beyond what most marketing reporting tools offer. The visualisation quality is consistently cited as a strength, and the platform is well-regarded for making it easier to present complex data to senior stakeholders in a format they can engage with. There’s a large, active user community with extensive training resources.
Where it falls short
Tableau is a visualisation layer, not a data collection or cleaning tool. Data needs to be structured and prepared before it comes into Tableau, which typically requires a data analyst or BI resource. It’s also positioned as an enterprise product, with pricing that reflects that, it’s disproportionate for teams that need straightforward marketing reporting rather than advanced analytics. Tableau works best when there’s already a data infrastructure in place to feed it.
Consider Tableau if
You have a data or analytics team and need to build sophisticated, interactive dashboards from structured data sources. Less suited to marketing teams looking for a standalone reporting tool without dedicated BI support.
Pricing
Free version available with limited capabilities. Creator from $70/month, Explorer from $35/month, Viewer from $12/month.
TapClicks
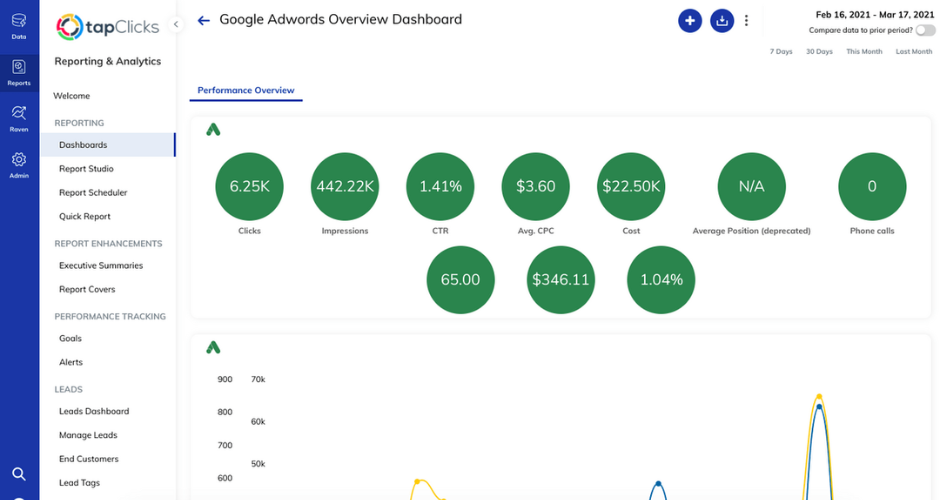
What we’ve seen it do well
TapClicks is built for high-volume agency and media company reporting. It connects to numerous data sources, supports automated report scheduling and delivery, and includes workflow and campaign order management features that go beyond what standard dashboard tools offer. Data blending across sources was improved in 2025 with unified blending across connector types, making it easier to combine data from different parts of a marketing stack into a single view. For large agencies managing hundreds of client campaigns, the centralised interface and white-label capabilities are practical.
Where it falls short
Setup is consistently flagged as complex, even by technically experienced users. Several reviewers noted that getting to a usable, accurate report took months of configuration with support involvement, and some were unable to achieve reliable data accuracy before discontinuing. The platform is not built for self-service, it rewards teams with a dedicated data person who can manage the backend. Customer service experiences have been mixed, and the pricing structure (a data ingestion layer plus a separate reporting destination layer) can be harder to predict than simpler per-seat or per-client models.
Consider TapClicks if
You’re a large agency or media company with complex multi-channel reporting needs, a technical resource who can manage the platform, and a budget that reflects enterprise-level tooling.
Pricing
Data ingestion plans from approximately $349/month. Reporting destination plans are additional. Overall costs typically start around $500/month and scale significantly with connectors and tier. Free trial available.
Two Minute Reports
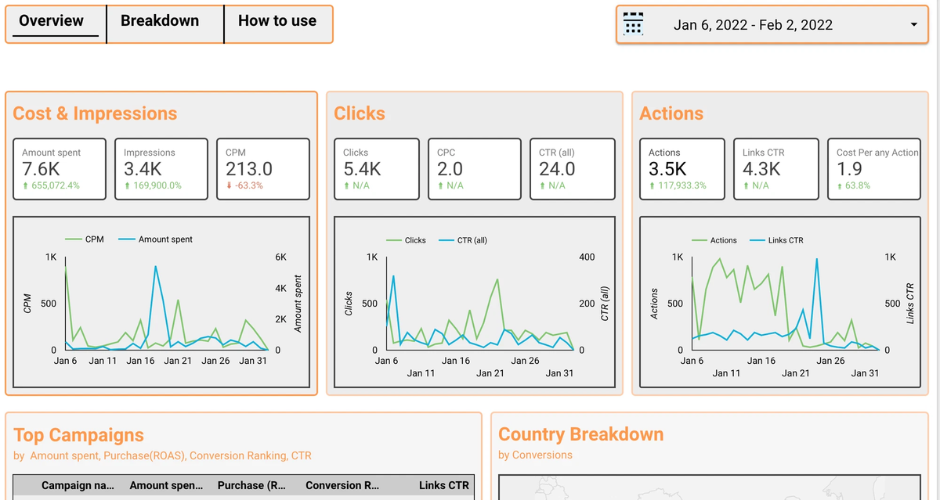
What we’ve seen it do well
Two Minute Reports sits within Google Sheets and Looker Studio rather than replacing them. It pulls data from 30+ marketing channels, paid, social, web analytics and more, directly into spreadsheets, automating the data collection step that tends to take up disproportionate time in manual reporting workflows. For teams already comfortable in Google Sheets, the transition is minimal. Report templates are available across common channel types, and the white-label options make it suitable for agencies delivering client reports.
Where it falls short
It’s an integration and reporting layer, not an analytics platform. The value is in automating data collection and structuring it for analysis, the actual analysis still needs to happen in Sheets or Looker Studio. Teams that need a standalone dashboard tool or one that goes deeper on performance insight will find it limited in that respect.
Consider Two Minute Reports if
Your team already lives in Google Sheets and wants to cut out the manual work of downloading and organising data from multiple platforms each month. A practical fit for agencies and in-house teams with straightforward reporting needs and no appetite for switching to a separate dashboard tool.
Pricing
14-day free trial. Lite from $8/month, Pro at $83/month, Enterprise available.
Whatagraph
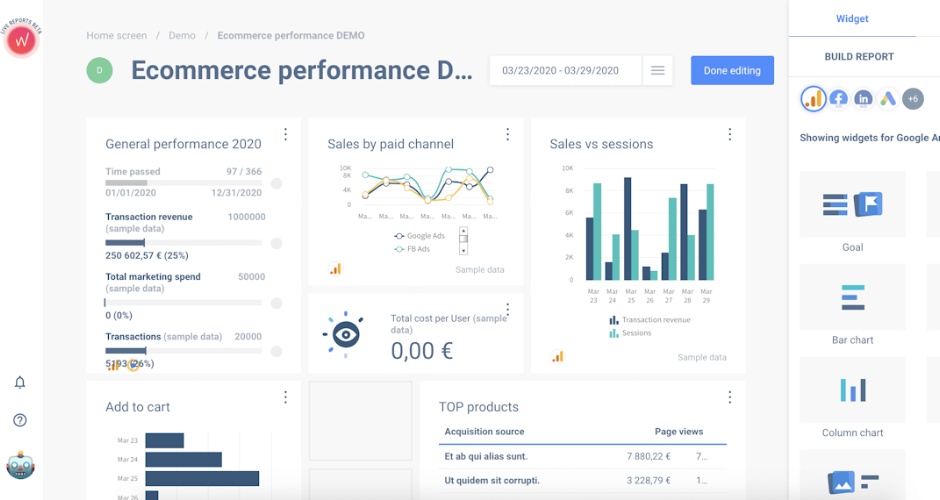
What we’ve seen it do well
Whatagraph is a cross-channel reporting tool focused on making client-facing reports fast to build and easy to share. It covers integrations, supports data blending across sources, and includes automated report scheduling and white-label capabilities. The template library is extensive, and the ability to link a master report template, so changes propagate across all client instances, is a genuine time saver for agencies managing high volumes of similar accounts. A dedicated Customer Success Manager is included on all plans, which is notable compared to tools where that level of support sits behind higher pricing tiers.
Where it falls short
Whatagraph moved away from publicly listed pricing in favour of a sales-led model, which makes it harder to assess cost upfront. The entry point is now around €7,500/year, positioning it firmly at the agency end of the market rather than small teams or in-house marketers. Some users flag that deep customisation, highly bespoke layouts or complex data transformations, can still hit limits, and the platform is primarily useful for marketing reporting rather than broader business analytics.
Consider Whatagraph if
You’re an agency that needs polished, automated, cross-channel reports at scale and wants a tool with strong support included as standard. The pricing model suits teams with a meaningful number of clients where the time savings justify the annual commitment.
Pricing
Pricing is sales-led and disclosed on request. Entry plans start at approximately €7,500/year (around $8,150 USD) for 50 data connections with unlimited users and reports.
What’s the right marketing reporting tool for your team?
Most tools here give you a clear view of campaign performance, and that’s genuinely useful.
But if the question you’re trying to answer is “which marketing activity is actually driving revenue,” the list narrows quickly. That requires connecting touchpoint data to what happens after the conversion, the deal value, the close rate, the channel that started it.
That’s what Ruler is built for. If you’re at the point where traffic and conversion data isn’t enough and you need to tie marketing spend to revenue, it’s worth seeing how it works in practice. Book a demo to see it in action.
Marketing reporting tools FAQs
A digital marketing reporting tool collects and presents your marketing performance data, covering metrics like clicks, leads, conversions and revenue, from one or multiple channels in a single view.
Analytics tools show what happened on your website, traffic, behaviour, conversions. Attribution tools go further, connecting those conversions back to the specific campaigns, keywords or channels that drove them, including revenue.
Many teams use a combination, for example, Google Analytics for website behaviour alongside an attribution tool like Ruler to connect that data to revenue. The right setup depends on what questions you’re trying to answer.