We shed light on how you can turn data into actionable insights to help drive strategic initiatives for your business.
You can have all the data in the world, but it’s useless if you’re unable to make decisions that can have a measurable impact.
With the exponential growth of data, there’s a demand for marketers who possess the ability to transform data into valuable insight.
During a study, we found that 24% of our respondents struggle when it comes to applying insight to data in analytics.
So, to overcome this challenge, we asked experts to weigh in and recommend the best practices and techniques to connect the missing link between data and valuable insight.
For this article, we’ll discuss:
- What are actionable insights
- Benefits of actionable insights
- How to make actionable insights
💡 Pro Tip
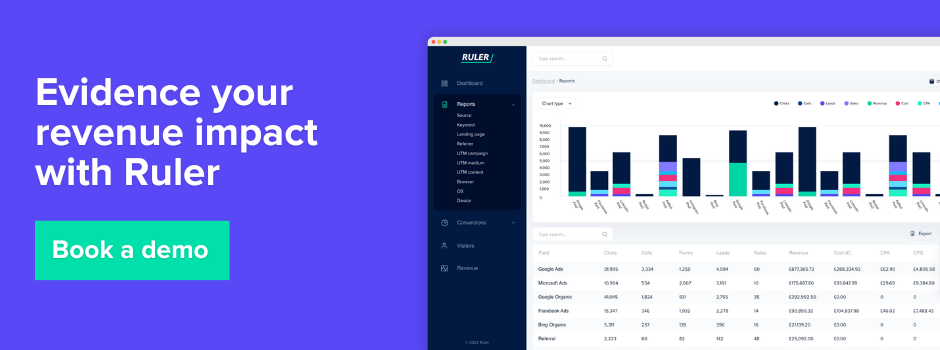
Need actionable insights to prove marketing’s impact on revenue but don’t know where to start? By unifying data and providing a complete view of customer interactions across multiple touchpoints and sessions, Ruler helps marketers optimise campaigns, increase ROI, and make data-driven decisions with confidence.
Book a demo and unlock actionable insights to prove marketing’s impact
What are actionable insights?
In its most basic form, actionable insights are meaningful findings that result from raw data in your analytics tool.
“There’s no value in telling a client something they can easily get from the Analytics, but there is value in helping them understand that the in-store activity they ran in France last month correlated with an uplift in average ecomm basket values from male customers over the age of 45,” explains Nick Craig, Managing Director at Mackerel Media Ltd.
Actionable insights have one main characteristic.
They drive action that leads to results.
Some actionable insights answer questions about the performance of your marketing. While other actionable insights recommend action or solve a problem.
For example, let’s say you own a SaaS website. And, your goal is to drive more demos and revenue.
You’re looking through Google Analytics and notice a sudden increase in bounce rate on your book a demo page. An actionable insight would be to change the design of your demo page and improve the intent of your copy.
What are the benefits of actionable data insights
Maximising the actionable insights you receive from your analytics are key to your data-driven marketing success. Here are some other benefits that actionable insights can bring to your company.
1. Allow you to make better decisions
No matter where you are in your marketing journey, there are always decisions to be made, and a lot can rest on these decisions. With actionable insights, you can gain the right information you need to back up your instincts and facilitate better decision making.
2. Help guide your marketing strategies toward success
Choosing the right marketing strategy is key to generating a higher ROI for a lower cost. Actionable insights can help you keep track of your marketing campaigns and how they’re performing. You can uncover the flaws and strengths of your campaigns and invest money into the channels that are getting you better leads and sales.
4. Improve customer experiences
Actionable insights can provide you with an abundance of information on your industry and customers. You can use analytics to extract key insights to identify problems in the customer journey and improve customer experiences to drive retention and improve ROI.
💡 Pro Tip
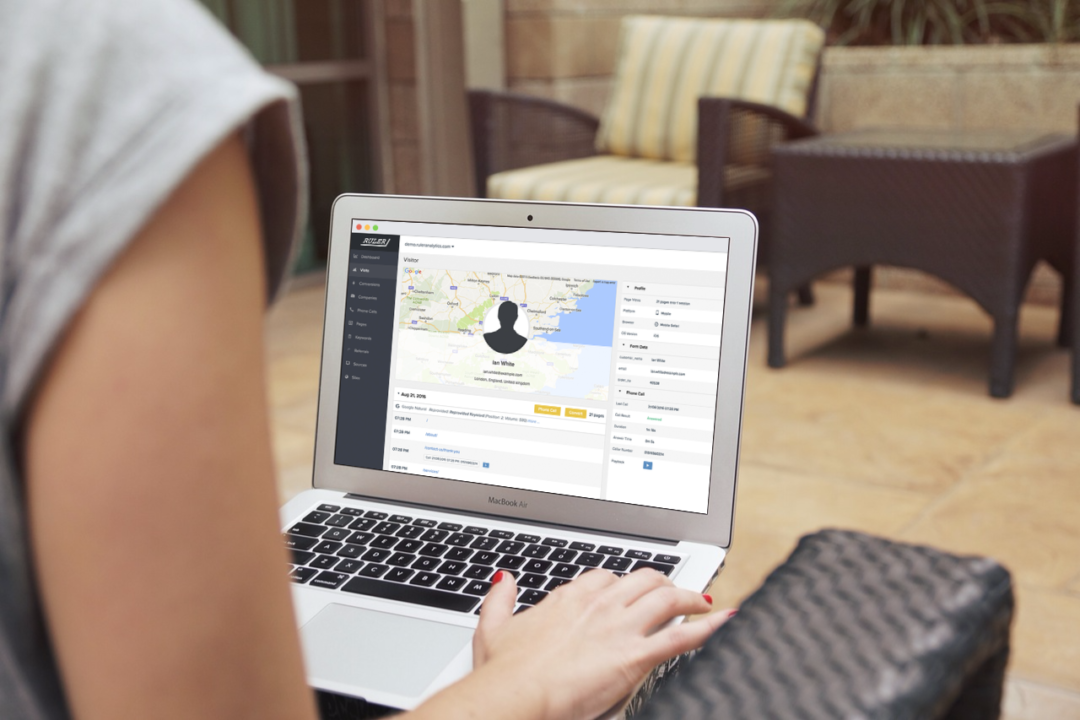
Need help tracking your customer journeys? Ruler keeps tabs on annoymous visitors on your website using first-party tracking. Every time someone returns, Ruler recognises them and tracks their activity.
When a visitor decides to become a lead – whether they fill out a form, chat with you live, or call you up – Ruler automatically sends their details and marketing journey to your CRM.
Once that lead becomes a paying customer, Ruler shares the sales figures and how they found you back to its dashboard. This gives you a clear picture of how customers discover and buy from you, helping you understand what’s working best.
Book a demo to see how Ruler track’s visitor and customer journeys
How to convert data into actionable insights?
Transforming data into actionable insights is tricky, but it doesn’t need to be. With the right tools, goals and process in place, it can be easy to build a bridge between your analytics data and valuable insight.
Below are a few tips to help get the wheels turning:
- Define your goals and objectives
- Invest in the right analytics and attribution tools
- Use context to simplify data
- Use visuals to show your findings
Define your goals and objectives
First things first, in order to gain actionable insights, you need to outline your goals and objectives.
It is pointless to track data and draw conclusions if those findings aren’t going to move you close towards your goals.
Actionable insights depend entirely on the right data.
Avoid tracking data that isn’t important to your overarching business goals. There are tons of vanity metrics that sound impressive and look good on paper, but in reality, add no value to your business.
Related: Vanity metrics vs actionable metrics: A guide to tracking the right data
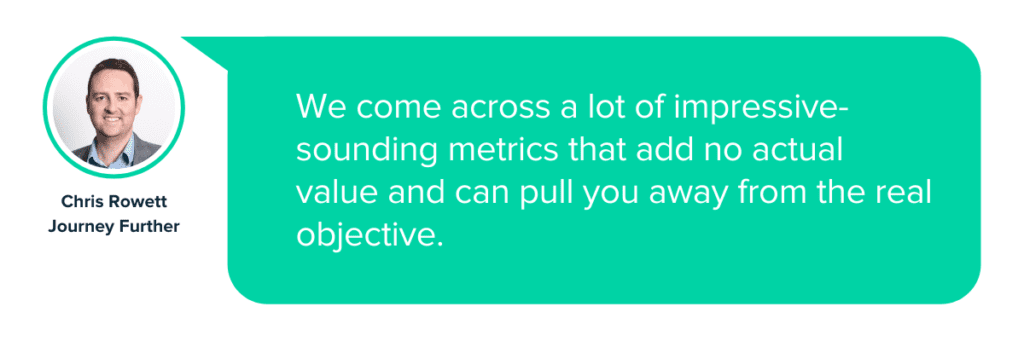
Performance Director at Journey Further, Chris Rowett, agrees: “You shouldn’t add any metrics or dimensions to your report that are not important to the objective. We come across a lot of impressive-sounding metrics that add no actual value and can pull you away from the real objective.”
Invest in the right tools to capture actionable data
Choosing the right data analytics tool is essential to turning troves of data into valuable action.
When it comes to capturing actionable data, however, there is an endless number of analytics tools that claim to be the one and only solution for the job.
Related: 10 marketing analytics tools and software for data-driven marketers
And, with so many tools to choose from, it’s hard to know which one truly is the right one for your business.
As a result, many marketers turn to Google Analytics to capture, measure and analyse actionable data.
But while Google Analytics can determine where users are coming from and how they found your website, it falls short at turning that data into action.
Related: Limitations of Google Analytics and how to overcome them
For example, let’s say your goal is to drive more revenue through marketing. Google Analytics says your Google Ad and Facebook campaign both generated 50 leads each last month.
That’s great, but which campaign contributed the most revenue? Who converted into a deal and who didn’t?
Remember the goal is to drive revenue for your company.
And, while leads are a good indicator of how well your campaigns are performing, they don’t guarantee revenue.
That’s what makes Ruler’s marketing attribution solution so powerful. It closes the loop between your marketing leads and revenue and provides the data you’re missing in Google Analytics.
Let’s go back to our previous example. Both Facebook and Google Ads generated 50 leads. With Ruler, you can track each and every lead that was generated via these campaigns throughout the entire customer journey.
Related: How to view full customer journeys with Ruler
After some time you analyse the results and find that Google Ads had an ROI 5 times higher than Facebook. You can use this data to drive action and invest more money and time into your Google Ads campaigns.
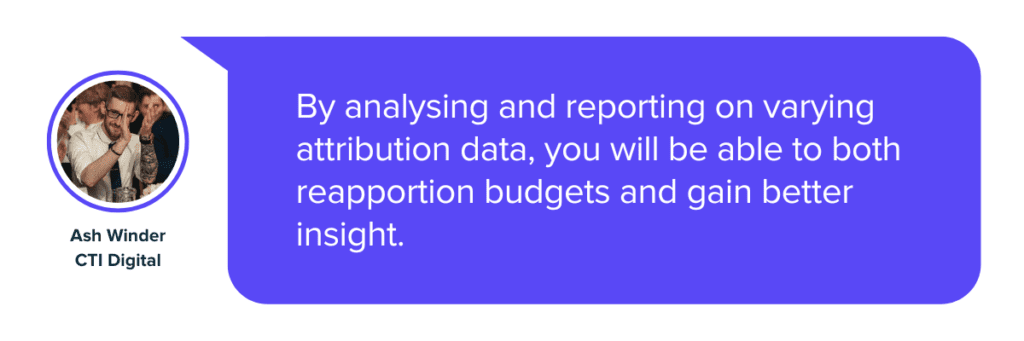
Ash Winder, Marketing Lead at CTI Digital, agrees that “marketing attribution tools can seem daunting and overly technical to understand at first. But Ash added: “By analysing and reporting on varying attribution data, you will be able to both reapportion budgets and gain better insight.”
Use context to explain your numbers
“The main point of reporting is not so much delivering KPIs and how performance has fared, but rather “why” things have developed the way that they have and how to make the most of your learnings moving forward,” says Kherrin Wade, Strategy Director at Adido.
Data is just the beginning.
It only becomes valuable when you add context to the mix. If your report isn’t formed by context, you’re essentially presenting arbitrary numbers.
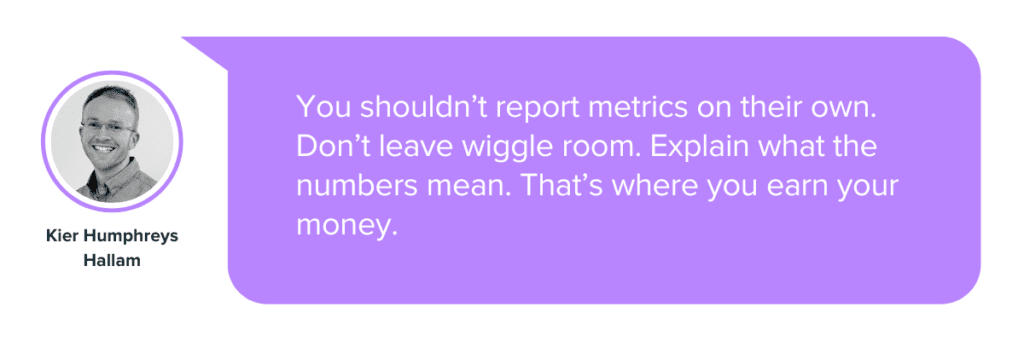
Experience Director at Hallam, Kier Humphreys, agrees: “You shouldn’t report metrics on their own. Don’t leave wiggle room. Explain what the numbers mean. That’s where you earn your money.”
At this point you are probably wondering where to start and how to take the first step.
One technique you could use is the 5Ws of reporting.
- Who
- What
- Where
- When
- Why
This simple, yet effective formula, is a great way to structure your data and create an interesting story about your performance.
Head of SEO at Own Your Space, Mindy Gofton, will inform clients about significant changes and “explain what the next steps would be. What the client can expect in the next strategy cycle, and why we’re recommending the next stage in the strategy to be delivered in a certain way.”
Mindy added, “We have found that reporting in this way, rather than by sending reams of statistics and ranking positions, really helps clients understand the impact of their digital marketing campaigns because they need the interpretation of the numbers far more than they need the numbers.”
Use visuals to show your findings
“Drop data-centric tables for graphs and charts where applicable, this makes important information easy to digest for key stakeholders and can be a more effective method of communicating your point,” says Ash.
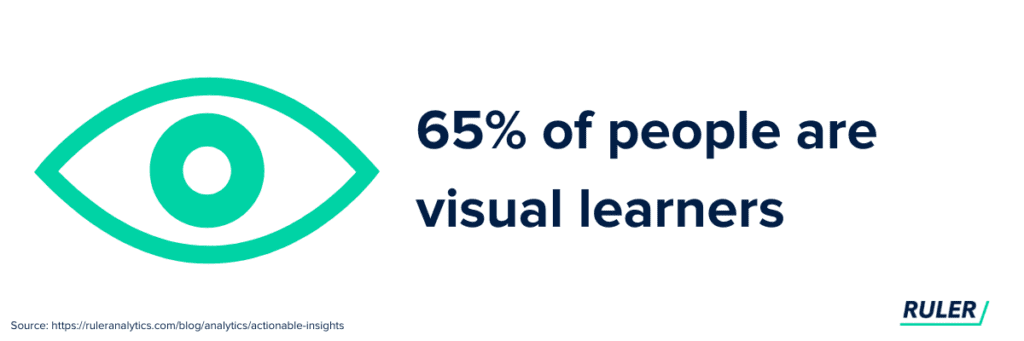
As the famous saying goes, a picture is worth a thousand words. As it stands, it is estimated that 65% of the population are visual learners.
Using charts and graphics are a great way to help your readers follow and understand your data research.
By integrating visual data, you can reduce the amount of time it takes to create a report, allowing you to focus on more important tasks to scale your business.
Are you ready to turn your data into actionable insights?
Actionable insights are key to your success.
They inspire smarter decision making and help guide your marketing strategies towards victory.
Related: How Ruler Analytics can help you optimise your marketing strategy
We hope you’ve enjoyed reading these tips as much as we did and feel more confidence to convert your data into actionable insights.
Remember, if you’re looking to generate deeper and more valuable insights into your marketing ROI, then Ruler is the tool for the job.
Ruler tracks users through the full customer journey and allows marketers to see which touchpoints are working to reach, engage and close revenue.
You can learn more about Ruler and how it helps businesses track and improve ROI. Or alternatively, book a demo and see Ruler in action for yourself.