We cover why siloed platform reporting leads to incomplete budget decisions, where tools like Google Analytics fall short, and how to build a unified view that connects paid activity to actual revenue.
If you run paid activity across more than one platform, which most teams do, you already know the frustration. You’re pulling numbers from Google, from Meta, from LinkedIn, from wherever else your spend is running, and none of them quite add up.
Each one tells a slightly different story, and the job of working out what’s actually happening across all of them falls entirely to you.
This actively shapes how decisions get made, and often not in the right direction. 21% of marketers who run paid activity say they struggle to track it effectively. For paid social specifically, that number rises to 25%. And 25% of respondents are using four or more tools just to get a handle on their paid performance.
That’s a lot of overhead for something that should be giving you a clear, consolidated answer to a straightforward question: what is our paid activity actually delivering?
This post is about why that unified view is so hard to get, where common attempts to solve it fall short, and what a more complete approach actually looks like.
- Why you need to put ad platform data into one view
- Marketers go to Google Analytics, but it’s not the full picture
- How to unify ad platforms into one view
💡 Pro tip
Ruler Analytics is built to do exactly what this post describes. It tracks every visitor across their full journey, ties that activity to revenue in your CRM or ecommerce platform, and surfaces a single source of truth across all your paid channels. Rather than toggling between platform dashboards and trying to reconcile numbers that will never agree, Ruler pulls everything into one view, attributed to real outcomes, not self-reported platform metrics.
Book demo to see how it works
Why you need to put ad platform data into one view
Each platform is reporting on its own success, and that’s a problem.
When you look at Google Ads, it tells you what Google thinks it contributed. When you look at Meta, it tells you what Meta thinks it contributed. The same logic applies across every platform you’re running. And because each one is using its own attribution model, its own conversion windows, and its own rules for what counts, they’re not working from the same definitions.
Related: How double-counting conversions in ad platforms skews budget allocation
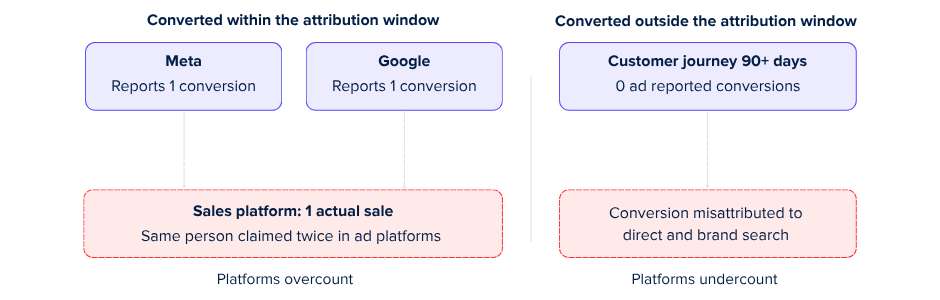
The practical consequence is that the same conversion gets claimed multiple times.
Someone sees a Facebook ad, clicks a Google ad a few days later, and converts. Meta counts it, and so does Google. Your total reported conversions are now higher than the number of actual customers you acquired, and your ROAS figures across both platforms look healthier than they have any right to.
Related: Why GA4 and Ad platform data don’t match and what to do
Beyond the double-counting, there’s the issue of attribution windows. Most platforms default to fairly short windows, typically seven days from a click, sometimes less. But people don’t buy from a single touchpoint on a short timeline, particularly for anything where the decision takes some thought.
What we see consistently in the journeys we’ve tracked is that paid social tends to sit earlier in the funnel, introducing someone to a product or brand, while paid search picks that person up later when they’re closer to a decision. Both played a role. But if the search click happened within the attribution window and the social impression didn’t, only one of them gets credit.
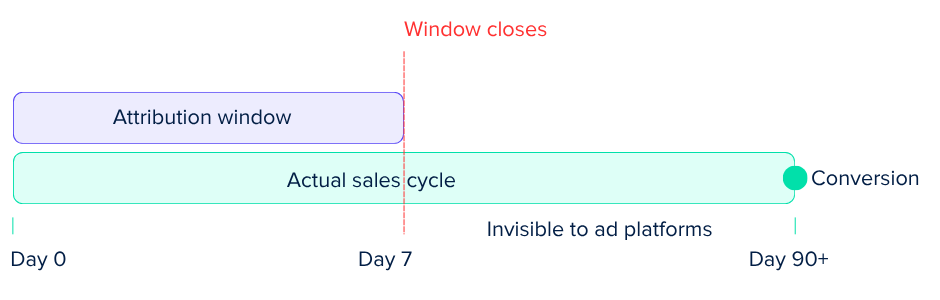
When you’re looking at each platform in isolation, you can’t see that relationship. You can’t see that social is feeding search, or that awareness spend is creating demand that performance campaigns later capture.
You just see each channel’s self-reported numbers, and those numbers are designed to make each platform look as useful as possible. Getting everything into one place is how you start to see what’s actually happening.
Marketers go to Google Analytics but it’s not the full picture
Google Analytics is the default starting point for most teams trying to get a cross-channel view, and that’s understandable.
It’s widely used, and Google has made it easier to pull cost data from connected platforms directly into the dashboard. The appeal of having something that approximates a unified view without a lot of additional setup is obvious.
But the picture it gives you is incomplete in ways that matter quite a bit.
The cost import feature works well for Google’s own properties. For everything else, coverage is inconsistent. Bing, for example, isn’t automatically accounted for, and 54% of marketers are running PPC as a channel, which means a meaningful slice of paid spend often isn’t represented at all in what looks like a unified view.
Beyond coverage, there’s a more fundamental limitation around what Google Analytics models and what it doesn’t.
It tracks and models sessions, events, and goal completions. But those aren’t the same as revenue, and the modelling it does isn’t designed to attribute financial outcomes across your full channel mix in a way that’s useful for budget decisions.
The attribution models available are channel-level, not revenue-level. You can see which channels are driving more sessions or conversions in a relative sense, but translating that into confident spend decisions is a different matter.
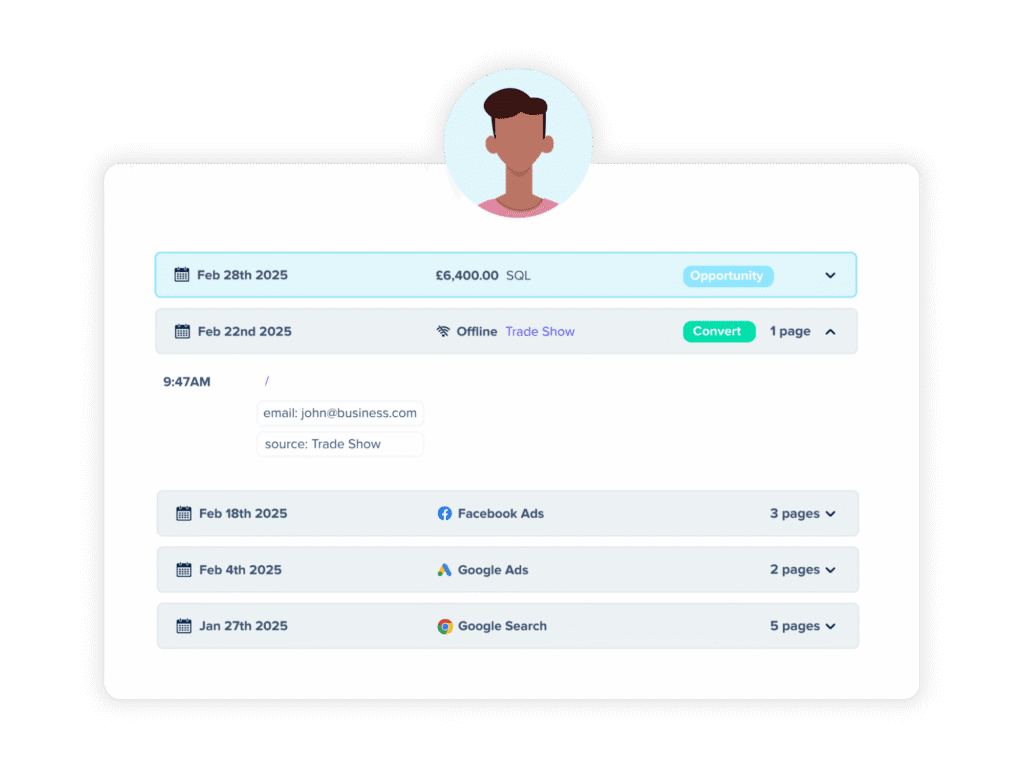
Then there’s the offline gap. What we hear a lot from the teams we work with is that a significant portion of their customer journey happens after the digital interaction ends.
Related: What to do when Google Analytics 4 misses conversions
Someone fills in a form, downloads something, starts a chat. And then the next thing that happens is a phone call, a meeting, a sales conversation. That offline path is where a lot of the actual revenue gets decided, particularly in B2B, services, financial products, and anything with a considered buying process. Google Analytics has no visibility into that.
So the conversions it reports are only the ones that closed digitally, and the channels that drove the offline ones get no credit.
None of this means Google Analytics isn’t useful. It is. But using it as your unified view means accepting a picture that’s missing too much to make confident decisions from.
How to unify ad platforms into one view
Getting a genuinely unified view of your paid activity means stepping outside the siloed reporting that platforms provide and building something that pulls from all of them on equal terms. It also means acknowledging that tools like Google Analytics, while useful, can’t complete that picture on their own.
Here’s how we’d approach it.
Start with first-party tracking at the individual level
The foundation is capturing what actually happens across the full journey, tied to individual users rather than aggregated sessions. That means UTM parameters, click IDs, session data, and page view sequences collected and stored in a way that persists across multiple visits over time.
Most analytics platforms either aggregate this data or strip out the individual-level detail before you can do much with it.
Related: 4 steps to create a first-party data strategy
What you need is tracking that keeps the journey intact, specifically which channel first brought someone to you, how they behaved across subsequent visits, and what eventually led to a conversion.
That granularity is what makes everything else in this framework possible. Without it, you’re just working with incomplete aggregates from each platform and hoping they tell a cohesive story.
Connect your tracking to actual revenue
Tracking alone doesn’t close the loop. Based on the conversions we’ve analysed, only 64% of marketers are measuring revenue at all, which means a large number are making budget calls based on conversion events that may or may not reflect what’s happening financially.
Connecting your tracking through to your CRM or ecommerce platform means you’re attributing actual revenue rather than proxy metrics.
It means you can see which paid channels are generating customers and value, not just which ones are generating form fills or clicks. And it changes the quality of the conversation you can have internally about where paid spend is and isn’t working.
Send revenue signals back to ad platforms
Once you have that link established, the next step is feeding clean revenue data back to the platforms as offline conversions. This gives the algorithms real signal to optimise from, rather than the partial, in-platform data they’d otherwise be working with.
Related: First-party data activation: A smarter path to better ad targeting
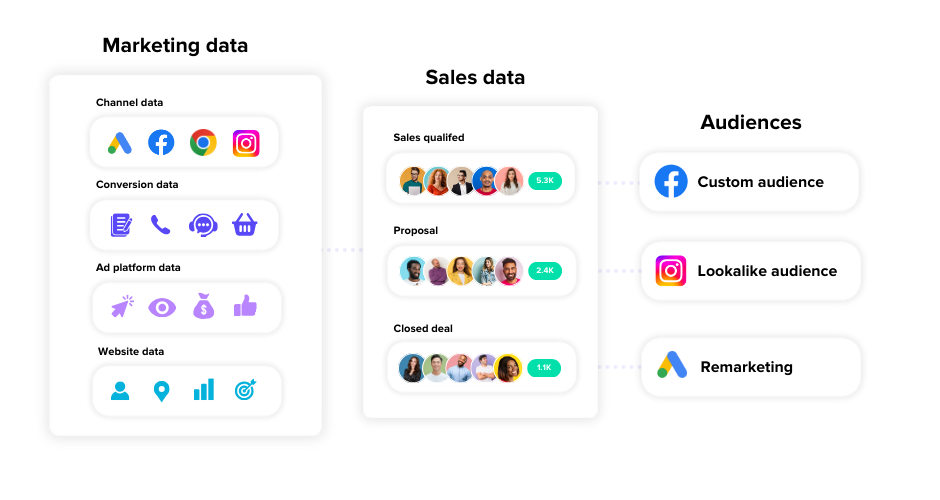
What we’ve found is that this is one of the most underused levers available to paid teams. Platforms can improve their bidding and targeting when you give them better feedback. But they can only use what you give them. If the signal you’re sending back is incomplete or delayed, you’re essentially asking the algorithm to navigate with a partial map.
Bring in marketing mix modelling for the channels attribution can’t reach
First-party tracking and offline conversions get you a long way. However, they can’t account for everything that influences outcomes. Impression-based campaigns, connected TV, traditional media, seasonal shifts, competitive activity, these all affect performance without leaving a click-level fingerprint.
Marketing mix modelling takes a different approach, modelling the relationship between inputs and revenue outputs across all channels, including the ones that don’t generate direct interactions.
It’s particularly valuable for two things.
First, it gives you visibility into channels that attribution alone would either miss or systematically undervalue. Second, it identifies diminishing returns before you hit them, telling you not just which channels are working but how hard each one can be pushed before the returns stop justifying the investment.
From the work we’ve done across clients, this is where some of the most significant efficiency gains tend to sit. Not in cutting spend, but in understanding where each additional pound is most likely to generate a return, and where the curve has already started to flatten.
But that insight only creates value if it translates into better decisions at the point where money actually gets allocated.
Related: How marketing mix modelling transforms budget planning
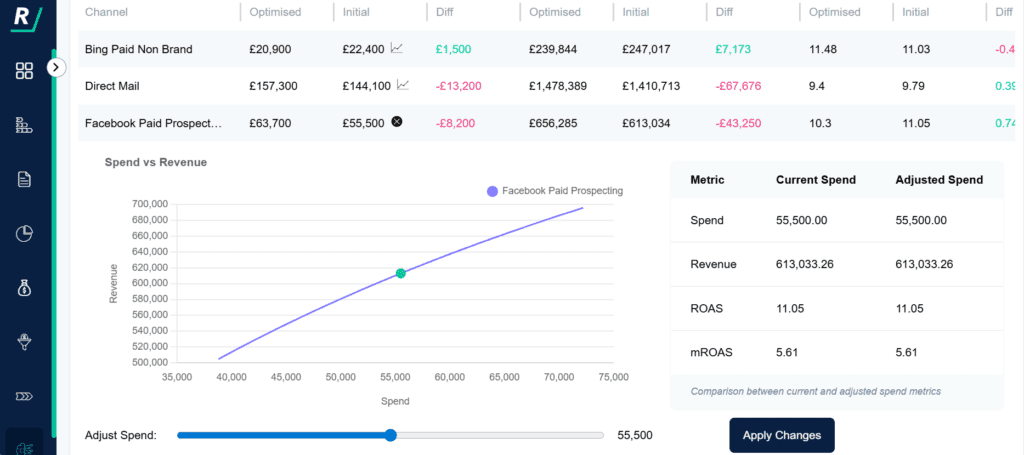
A budget scenario solution, like in Ruler, lets you model what happens to projected outcomes as you shift spend across your mix, based on your actual performance data and the curves the model has built.
Rather than relying on gut feel or platform-reported ROAS, you can test scenarios before committing. What happens if you move budget from paid search into paid social? Where’s the efficient frontier for this campaign before returns start to diminish? What does revenue look like at different total spend levels?
These are questions that should be answerable before the budget is set, not after you’ve already run it.
Putting it all together
The teams we speak to who are getting the most from their paid activity aren’t the ones spending the most. They’re the ones working from the clearest picture.
That starts with first-party tracking that captures the full individual journey, not just the last click. It requires linking that tracking through to actual revenue, not just conversion events.
It means feeding clean signals back to platforms so the algorithms have something real to optimise from. And it means accounting for the channels and influences that deterministic tracking can’t reach, through modelling that gives you a view of the whole system rather than just the parts that are easy to measure.
Getting all of that into one view isn’t just a reporting improvement. It changes how confidently you can make budget decisions, how clearly you can demonstrate what paid activity is contributing, and how quickly you can spot when something isn’t working before it costs you more than it should.
If you’d like to see how Ruler brings all of this together in practice, book a demo with our team and we’ll walk you through it.