Ruler Analytics is a key marketing measurement tool that can help businesses understand the impact of their marketing team and get a true return on investment.
If you work in marketing and your day to day job is about building your pipeline, creating new leads or targeting businesses, chances are you struggle to prove your return on investment.
Time and time again, questions are raised about marketing performance and how it can be improved.
Related: How to measure marketing performance
But the truth is, the marketers we mentioned struggle to prove their worth.
And for good reason.
People visit your website anonymously. So, when they close into a lead and are fed into your CRM, you’re going to struggle to connect that person to one of the hundreds of website sessions you generate.
Related: 6 easy ways to track your marketing leads
Even with minimal lead tracking setup, it’s hard.
Users don’t land on a website and convert first time anymore.
Long customer journeys mean you’re left scratching your head on how to connect all the data you have across lots of different tools.
But worry no more.
We’re here to run you through how Ruler can help.
We’ll go through:
- How to measure marketing performance by revenue
- How to get an overall view of your marketing performance
- Steps to find your best performing channel
- How to measure content marketing
- How to measure paid campaigns
And remember, all of this is only available in Ruler. So, let’s get stuck in!
💡 Pro Tip
Want to see the data in action? We don’t blame you. Go through all of the reports and data available with one of our experts to better understand how we can help you.
Book a demo with our team
Measure marketing performance by revenue
Ruler’s main selling point for marketers is that it can effectively link revenue back to marketing.
Related: How Ruler attributes revenue to your marketing
Say goodbye to reporting on revenue and marketing in two separate silos.
With Ruler in place, you can definitively prove how marketing impacts revenue.
And more than that.
You can view the revenue created by channel, campaign, ad and even keyword.
It gives you a clear picture of what works in your marketing arsenal, and what doesn’t.
And with that data at hand, you can make quick effective decisions to optimise your strategy.
Related: How Ruler helps you optimise your marketing strategy
How Ruler tracks marketing revenue
In case you don’t already know how Ruler works, here’s a quick recap.
Anonymous visitors land on your website. With Ruler in place via a little bit of code, you can track these touchpoints along with other marketing variables like the time they spent on site and which pages they engaged with.
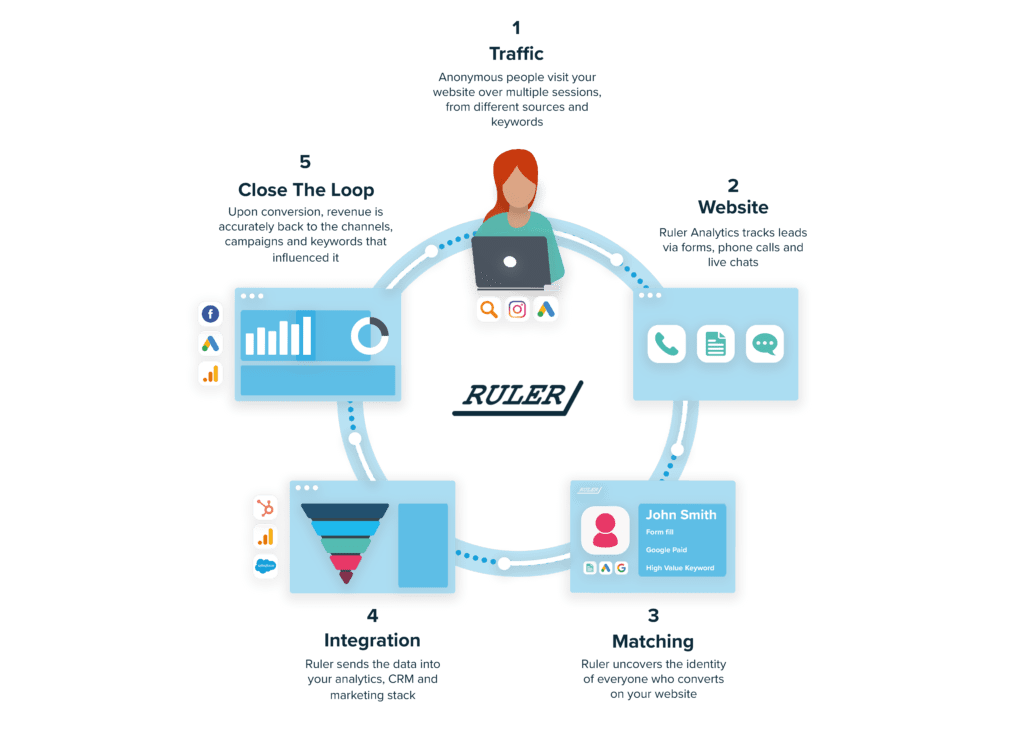
This is Ruler building profiles for your visitors.
When those visitors return, Ruler will continue to scrape key information on them and host it. As soon as those visitors convert into a lead, Ruler will fire all of the information held on that user to your CRM.
Related: How to send lead source data to your CRM
So, in your CRM, you’ll be able to see exactly which source drove that new lead.
But it doesn’t stop there.
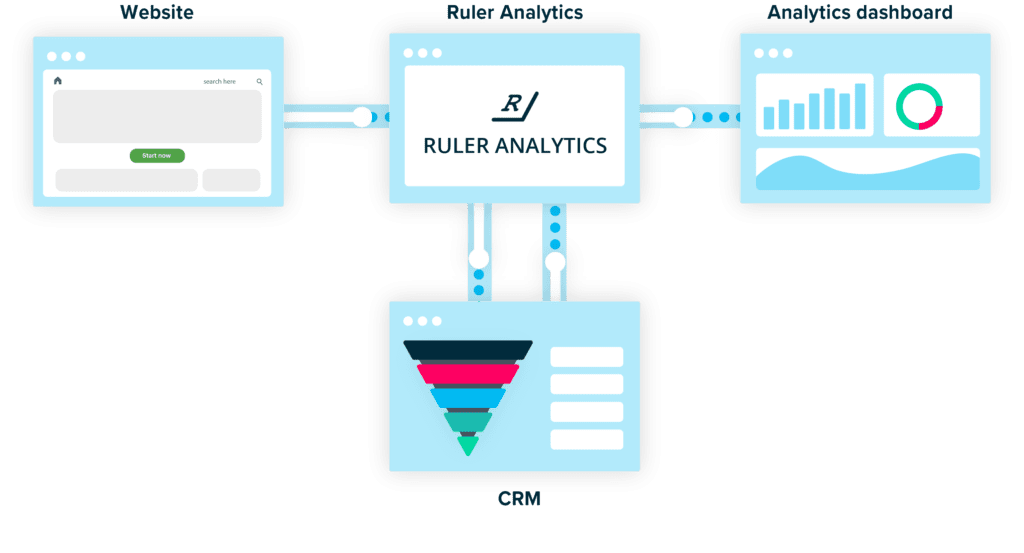
Ruler continues to track that user. At the point of sale, Ruler will scrape the revenue data inputted into your CRM against that user and fire it off to your marketing analytics tools.
In tools like Google Analytics, Ruler will automatically attribute the revenue to the influencing channels, campaigns, ads and even keywords.
This gives you a definitive view of how much revenue you’ve generated, and what influenced those sales.
Related: How Ruler tracks and forecasts revenue
How to view revenue against your marketing
There are a number of reports in Ruler that you can use to view your inbound revenue.
They include:
- Source report
- Attribute reports
- Revenue report
- Opportunity report
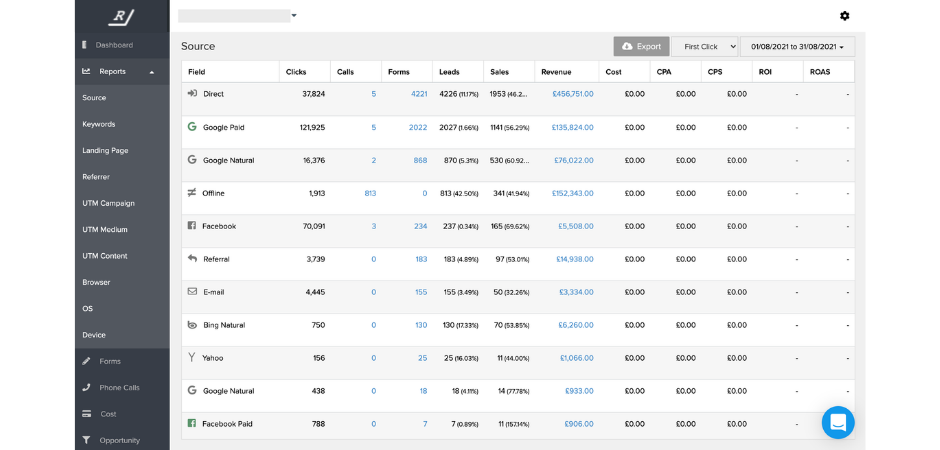
Source report
The source report is a great one to check as you can get a definitive understanding of which marketing channel generate the most:
- Clicks
- Leads
- Sales
- Revenue
Ruler splits this report into channels like:
- Google natural (organic)
- Direct
- Email marketing
- Bing paid etc
As an overall view, this report is great for seeing which channels work best for their specific purpose.
For example, you might find one channel is great at creating leads while another is great at closing them.
This kind of insight helps you to build a really smart, and custom, marketing strategy.
Attribute reports
Ruler also offers a whole host of other reports where you can break down performance by clicks, leads and sales.
They include:
- Landing page report
- Keyword report
- UTM reports
These are useful as they give you a deeper understanding of what works on a much more granular level.
While the source report shows you which channels are driving the most for your business, these reports offer some deeper insights into specific campaigns, ads and keywords.
Revenue report
The revenue report in Ruler lists every single sales created by your business and also offers more detail like:
- Date of sale
- Sale value
- First-click source
- Last-click source
This is a great place to start when you’re looking at your closed customers to understand what’s closing them and which channels are supporting those sales.
For each listed revenue, you can click in and view that customer’s full journey from end to end.
This is especially useful when trying to understand where high-value customers are generated and closed.
Opportunity report
The opportunity report in Ruler offers a pipeline view of your inbound revenue. Plus, it maps this revenue to your chosen customer journey stages.
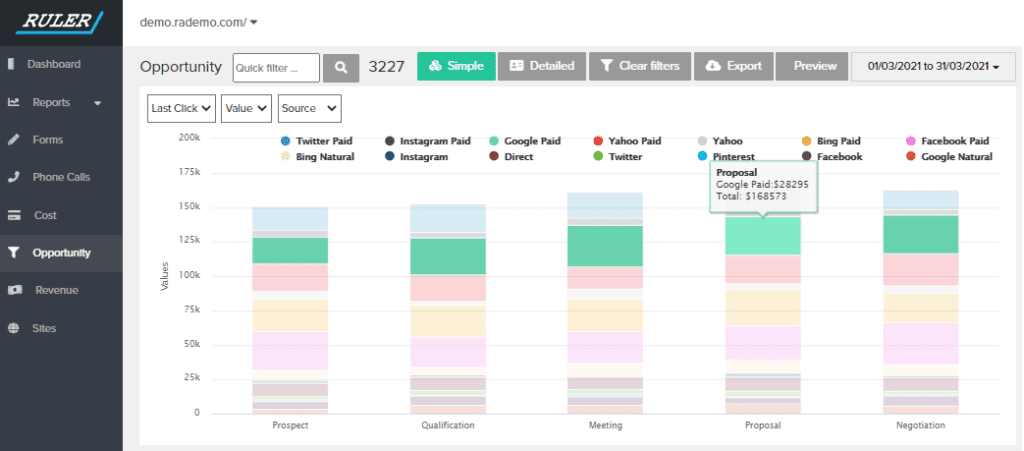
For example, if you have a set customer journey set up in your CRM, you can apply that data to Ruler and view the amount in your pipeline broken down by the channel that influenced it.
Find your best performing channel
Now you know how to view closed revenue, let’s look at understanding your marketing performance on a higher level.
As mentioned above, the source report is a great report for marketers looking to understand the overall performance of their marketing efforts.
It’s where you can break down your clicks, leads, sales and revenue by channel. And it means you can get a view of what channel works best.
Here’s what it looks like in practice:
👉 Book a demo of Ruler to see this report in action
As we can see from this example, Facebook paid brought in the most leads, but Google paid closed the most revenue.
The great thing about Ruler is that you can easily view your return on investment to understand which channels are working the hardest.
How to measure content marketing
Content marketing can be a tricky channel to track. Users likely consume a lot of different content on your website. So how do you connect all of those different marketing touchpoints together?
And even more importantly, how do you prove that content is starting or closing customer journeys?
Ruler’s report is the perfect way to measure your content marketing.
We use it ourselves to understand which blogs are consistently driving high-quality leads.
Want to see the 4 easy steps you need to follow to attribute sales to your content? Here’s what we do each month, so let’s break it down.
- Pull your closed leads from the form report
- Filter your leads by the conversion you care most about
- Create a pivot table for first-click source
- Add in revenue data
Pull your closed leads from the form report
First things first, head to the forms report.
There, click ‘detailed’ and export for your chosen date range. We usually do a month at a time or a quarter in one batch.
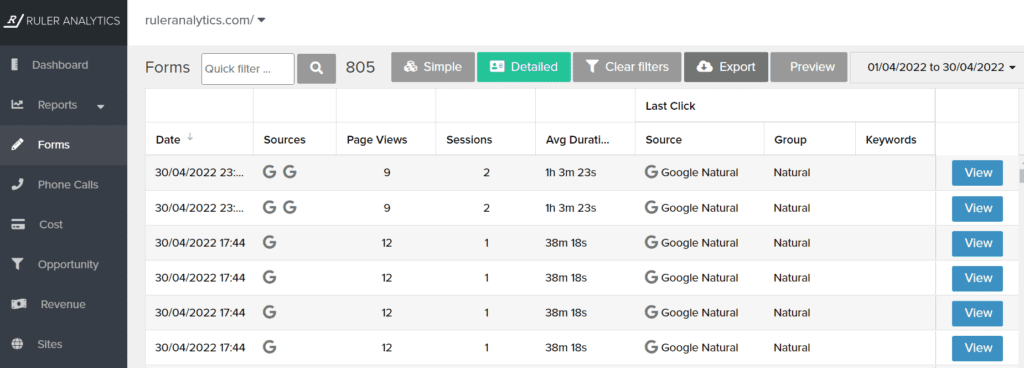
This will download a csv of all the inbound leads you’ve created via forms.
Filter your leads by the conversion you care most about
Open up your csv and start filtering your leads.
For example, we have some contact forms, demo forms and content forms. So, for this exercise, we filter them out so we can only see leads that filled in a demo form.
This gives us a full view of our leads for that time period.
Create a pivot table for first-click source
Then, we look at the first-click source. Since we know a lot of our leads come from organic search, this is a great exercise for us toget a handle on which blogs are driving high-quality leads.
Copy and paste the full list of first-click sources and landing pages to another sheet. For each, add a count next to each row.
Then, you’re ready to make a pivot table.
Highlight both columns and select ‘Insert’, ‘pivot table’.
Select where you want your pivot table to appear and then add in the value.
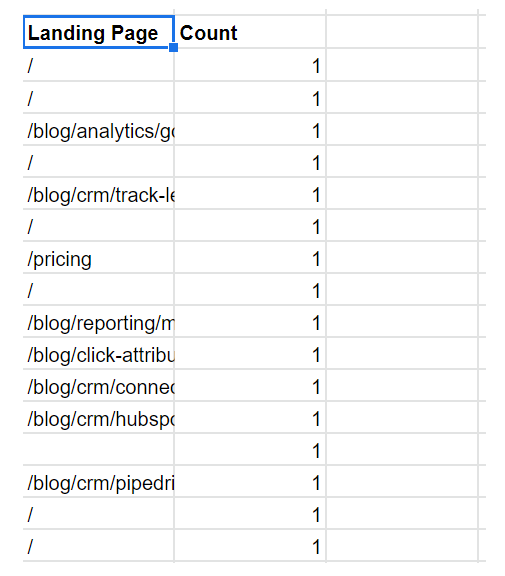
For landing page, rows would be ‘landing page’ and values would be ‘count’.
This pulls a counted list of all of your blogs that led to a demo.
Add in revenue data
Sometimes, for an extra level of detail, we look back at our leads to see if they converted into revenue.
So, we’ll go through our full list in the csv and highlight ones that went to an opportunity and ones that went to a sale.
We can then do another pivot table to only pull out those that resulted in closed revenue.
This is often a good exercise to do as it gives you a good sense of your lead quality. For example, you might find that one particular blog brings in a lot of new leads, but that they rarely convert.
That highlights there’s an issue with the content you’re sharing compared to your product or sales process.
How to measure paid campaigns
Measuring your paid marketing campaigns with Ruler is easy too.
There are three key ways that you can measure the effectiveness of your paid ads. Let’s go through them one by one.
Break down your ads by channel/source
If you’re running multiple campaigns on multiple channels, then the first place you want to look is your source report.
Here, you’ll be able to see the overall performance of each channel within any given time frame.
So, if you set live new campaigns across paid channels like Facebook, Bing and Google at the beginning of the month, you can simply use that to get a clear view of current performance.
You can assess each channel by clicks, leads, sales and revenue. And remember, your ad strategy might be to generate interest on Facebook and to close on PPC.
But with Ruler, you can swap attribution models meaning you can get a full view of how each works along the full customer journey.
⚡️ Pro Tip
Want to learn more about tracking marketing touchpoints to get a full end to end view on your marketing?
Learn how you can track full customer journeys in Ruler
Look into UTM reports
Not every business has endless amounts of budget to test multiple channels for paid advertising. We get it.
So, how do you break down your ad performance into more digestible chunks?
Well, with Ruler’s UTM reports, you can assess your ads based on each UTM category type:
- Campaign
- Medium
- Content
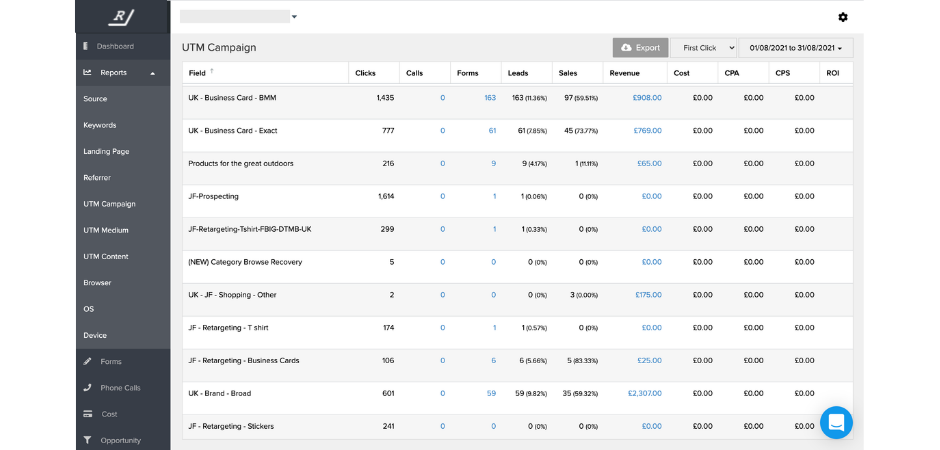
So if you have two ads running on Google, you’ll be able to break them down into smaller bites to get a better understanding of how each is working. This is especially great for A/B testing and segmentation.
Related: How Ruler can improve your paid advertising strategy
Use the keyword report
Last but not least is the keyword report.
More often than not, we’re bamboozled by data in tools like Google Ads. They show us how many clicks and impressions we might get, but we can’t predict how many leads or sales.
With Ruler in place, you can.
Related: Keyword-level call tracking
Since Ruler uses the GCLID (and other tracking variables) for your paid ads, it can pull through keyword data on your users.
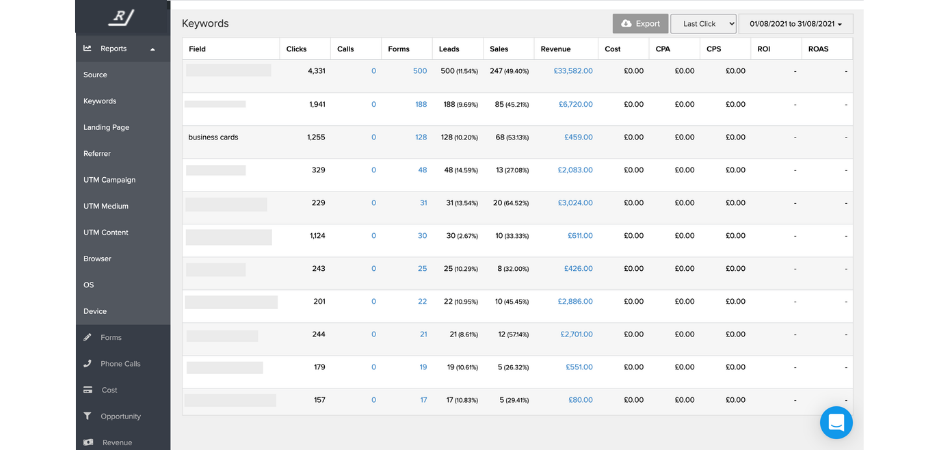
And you know what that means? Granular insights into which keywords are converting, and which aren’t.
Armed with this data, you can turn off what works and leave what does with more budget.
Start measuring your marketing using Ruler Analytics
Hopefully, this has given some good insight into how you can use Ruler to better report on and optimise your marketing.
Want to learn more? Book a demo with our team or keep learning. Sign up to Attribution Academy, our free e-learning platform on all things attribution.