Use Google Analytics 4 or a first-party data platform to track ROAS, prove your PPC impact, and fine-tune your results.
Today’s marketing teams are under more pressure than ever to deliver results, and prove them.
With tighter budgets and higher expectations, showing a clear connection between spend and revenue isn’t just important; it’s critical to keeping your programs funded.
Return on ad spend is a key metric that helps advertisers measure how much revenue is generated for every dollar spent on advertising.
While Google Analytics 4 is a powerful tool, it doesn’t display ROAS by default. The good news is, with a few extra steps, like importing ad costs and customising your reports, you can start surfacing ROAS directly within GA4.
There’s also a more advanced approach: using a first-party data platform that captures the full user journey. These platforms collect rich marketing source data, such as click IDs, UTM parameters, cookies, and page views, and connect them directly to high-intent conversions like form fills, phone calls, and live chat inquiries. (More on that shortly.)
In this post, we’ll walk through both methods so you can showcase your impact more clearly and make smarter, more confident budget decisions.
We discuss:
💡 Pro Tip
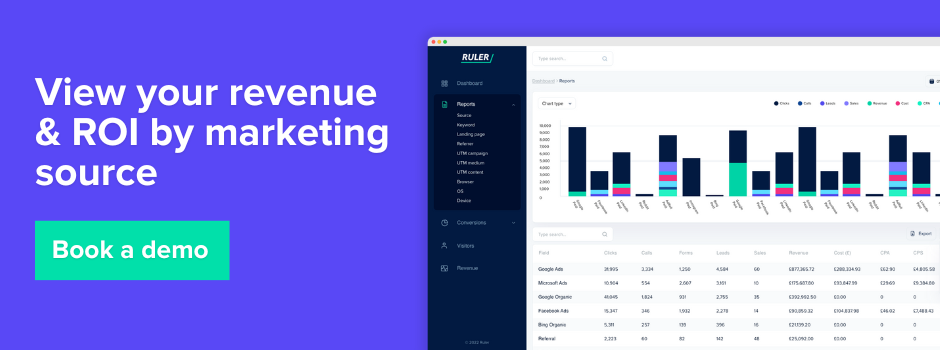
See how Ruler brings all your marketing touchpoints, conversions, revenue, and cost data together in one place to give you a complete, accurate view of ROAS. It tracks first-party data across the full customer journey, links it to real conversions inside your CRM, and connects every marketing interaction to revenue – so you can finally see what’s driving results.
Book a demo to see how it works in action
What is ROAS?
ROAS, or return on ad spend is the metric used to track the impact of your paid advertising on your bottom line.
Related: Complete guide to return on ad spend and how to track it
Similar to return on investment, return on ad spend looks specifically at how much revenue you generate compared to how much you spend on paid channels.
It’s calculated simply by dividing the revenue from your ads by the cost invested, which you then multiple by 100.
How to view ROAS in GA4
In GA4, Return on Ad Spend isn’t a built-in metric like it was in some Universal Analytics setups.
You need to piece it together, but once you do, it’s powerful. Here’s the steps you need to calculate ROAS in Google Analytics 4:
Step 1: Make sure purchase revenue is being tracked properly
Before you even think about calculating ROAS, you need to make sure your GA4 property is actually capturing purchase revenue correctly.
In GA4, revenue should be sent through the purchase event, and that event must include a value parameter.
The value parameter tells GA4 the total amount of the transaction (usually after tax and shipping, but it can vary depending on how your setup is configured).
If you’re an ecommerce brand, it just takes a bit of code in your shopping cart to start tracking this properly. Once that’s in place, you’ll have clear visibility into which marketing sources are driving the most revenue.
Platforms like Shopify, WordPress, or Squarespace offer built-in integrations that make it easier to pass transaction data to GA4 without heavy development work.
If you’re not selling products and your focus is lead generation, like form fills, you can still assign conversion values to your events. This lets you estimate the monetary impact of each lead and better understand your ROI.
There are a few steps involved for each setup. Instead of walking through all of them here, this blog post on tracking marketing revenue breaks down exactly what you need to do if you’re not already set up.
Step 2: Confirm ad cost data is available in GA4
ROAS (Return on Ad Spend) needs both revenue and ad spend data. GA4 only has cost data if you’ve connected your ad platforms properly.
For Google Ads, it’s pretty straightforward. Just link your Google Ads account to GA4 (Admin → Product Links → Google Ads → Link).
Once they’re connected, GA4 automatically pulls in metrics like ad cost, clicks, and impressions into your reports.
For non-Google platforms (like Facebook Ads, TikTok, LinkedIn, etc.), it’s a bit different. GA4 won’t pull in that cost data by default.
Instead, you’ll need to manually import it or use a tool like Supermetrics, Funnel.io, or a BigQuery pipeline.
Google Analytics uses cost data import to match spend from non-Google campaigns (like paid social or email) with your revenue and events data. This lets you calculate things like cost per click, cost per conversion, and ROAS – even for non-Google channels – broken down by campaign, source, or medium.
If you’re uploading manually, you’ll need to match the right dimensions (think Source/Medium, Campaign ID, etc.) so GA4 can correctly stitch the cost data to user interactions.
If you want the official step-by-step, Google has a full guide on how to import cost data into GA4.
Step 3: Create a custom ROAS metric in Explorations
Once you have both revenue and ad cost available, GA4 still won’t calculate ROAS automatically for you. You’ll need to create it manually inside an Explore report.
Here’s the process:
- Go to Explore → Free Form.
- Add dimensions like:
- Campaign (to see ROAS by campaign)
- Source/Medium (to see ROAS by traffic source)
- Or even Ad Platform if you want a higher-level view.
- Under metrics, add:
- Purchase Revenue (it might show up just as “Revenue” depending on your GA4 setup)
- Ad Cost.
Now create a new metric:
- Click the + next to Metrics.
- Choose Create Formula.
- Set the formula to be: Revenue / Ad Cost
- Name it something like ROAS (custom).
Once saved, GA4 will calculate ROAS dynamically for the dimensions you selected.
With your custom ROAS metric set up, you can start slicing and dicing the data. Some things you can do:
- Compare ROAS by campaign to see which ads are driving the most efficient revenue.
- Look at ROAS by platform (Google Ads vs Facebook Ads, for example).
- Break it down by geography if you want to see where you’re getting the best returns.
💡 Pro Tip
GA4 has key limitations – like anonymised user data, short attribution windows, and missing impression tracking – that make it hard to see the full picture of your marketing impact. Our measurement framework fills those gaps by integrating first-party data, marketing mix modeling, and incrementality testing to provide a more accurate view of what’s driving real business results.
Take a closer look at the framework by tapping here
The limitations of ROAS tracking in GA4
While the workaround mentioned earlier allows brands to measure ROAS in Google Analytics 4, it’s far from perfect. There are some limitations you should be aware of if you’re relying on GA4 to understand marketing effectiveness.
Limited attribution models
One of GA4’s biggest constraints is its narrow selection of attribution models. You’re essentially limited to two: last click and data-driven attribution (DDA).
Last click attribution gives all the credit to the final interaction before conversion. This is problematic in today’s multi-touch digital landscape, where users often engage with a brand across several channels and devices before converting.
On the other hand, DDA should offer a more nuanced picture, but it’s far from transparent.
Google doesn’t disclose how their DDA model weights different interactions. It’s a black box that leaves marketers guessing.
Plus, both models still operate within a constrained 90-day lookback window. If your customer journey takes longer, which is increasingly common as buyers take more control of their research, GA4 is likely reporting an incomplete picture.
Undervalues upper-funnel channels
GA4 has a fundamental blind spot when it comes to measuring the true influence of upper-funnel marketing – especially channels that are driven by impressions rather than clicks.
Platforms like TikTok, Instagram, and YouTube are increasingly used for discovery and brand building.
People might watch a product demo, scroll past an ad, or engage with influencer content without ever clicking.
Days or even weeks later, they might search your brand on Google and convert, but GA4 will attribute the conversion to that branded search, not the original impression that sparked the interest.
Since GA4 only tracks deterministic, click-based interactions, it fails to account for this kind of indirect influence. The result is a skewed view that overcredits lower-funnel channels like search and retargeting, while making it seem like awareness-driving efforts aren’t pulling their weight.
No insight into offline activity
GA4’s commitment to user privacy means it anonymises all visitor data.
While that’s great for consumer protection, it introduces serious limitations for marketers, particularly those with offline sales processes.
Most businesses use lead capture forms to initiate contact, but from there, the real sales process often moves offline: phone calls, email threads, product demos, and face-to-face meetings.
GA4 can show you someone filled out a form, but it won’t tell you whether they later booked a demo, asked for pricing, or became a paying customer.
For example, if you’re running a Facebook ad campaign, GA4 can track who clicked the ad and submitted a form.
But beyond that, the trail goes cold. If that person converts offline, say through a call or an in-person meeting, there’s no way to tie it back to the original marketing touchpoint inside GA4.
Alternative way to view ROAS
Google Analytics has its place, but it’s not the most dependable tool for measuring revenue or ROAS.
It’s great for surfacing trends and understanding general website behavior, but its limitations in attribution make it unreliable for tracking return on ad spend with any real precision.
That doesn’t mean you should stop using it, but it does mean that when it comes to ROAS, you need a more holistic and robust strategy.
You could turn to the native reporting in ad platforms like Meta, Google Ads, or TikTok.
They all have their own version of ROAS baked into their dashboards. But the issue is that these platforms operate in silos.
Each one only sees the activity that happens within its own ecosystem.
So if someone views a TikTok ad and later converts after seeing a Meta ad, both platforms might claim full credit for the sale.
This kind of double-counting leads to misleading results and makes it hard to see which channels are truly driving performance.
To get a clearer picture, what you really need is a unified, actionable view of each customer’s journey. That means connecting the dots between different data sources, layering on meaningful attributes, and aligning everything back to actual revenue outcomes.
Here’s how we do that to get a more accurate and transparent understanding of ROAS
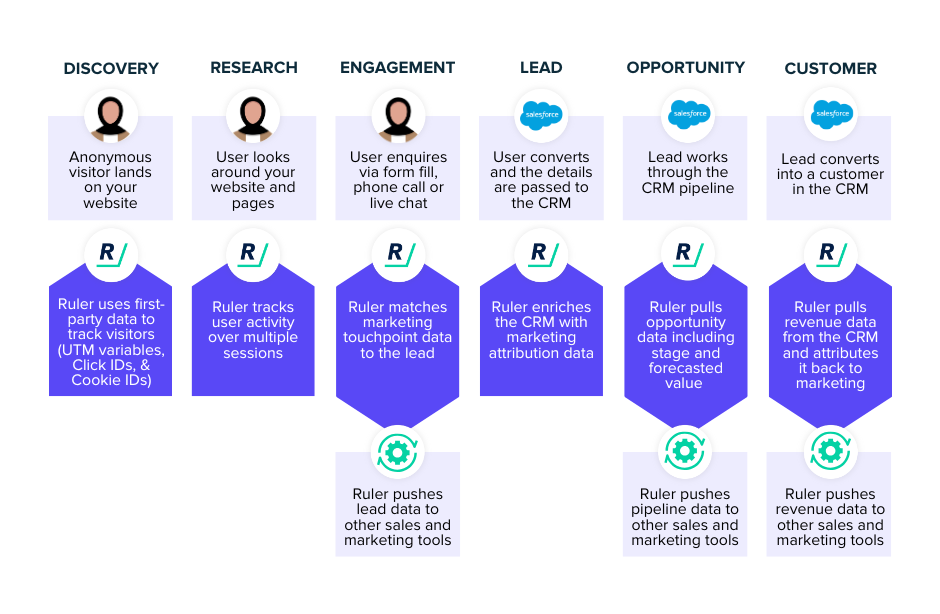
1. Capture individual first-party data across user touchpoints
GA4 prioritises user privacy, which means it anonymises visitor data and breaks the link between specific users and specific sessions.
As a result, you lose visibility into how individual users move through your funnel across time and touchpoints.
While it’s still useful for directional insights, it’s not enough if you want to track revenue back to individual marketing activities.
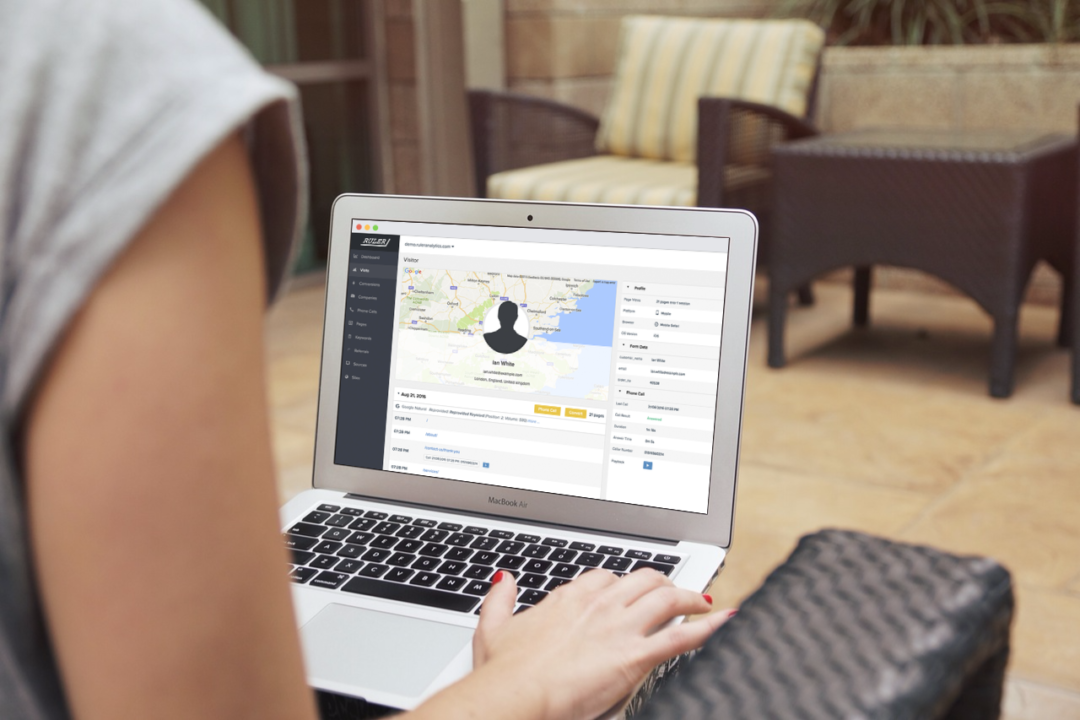
To close that gap, we use first-party tracking through a platform like Ruler Analytics.
Ruler collects user-level data such as UTM parameters, click IDs, cookies, pageviews, and timestamps.
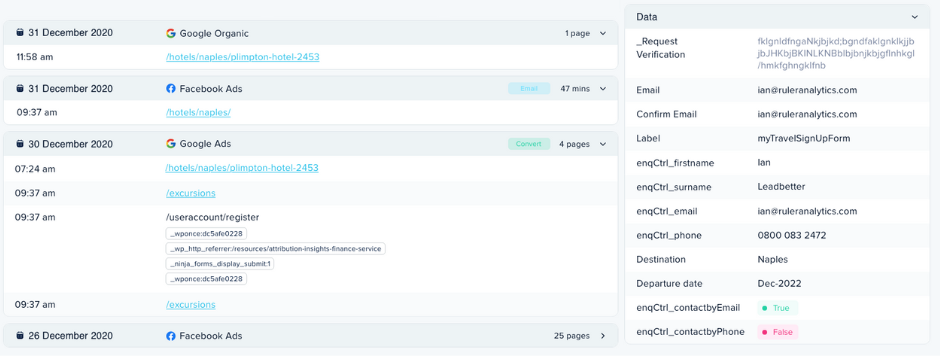
These are essential for reconstructing a user’s journey.
When properly stitched together, they reveal a comprehensive view of each person’s path to conversion – even across multiple visits and devices.
2. Tie those journeys to real conversions
Once you’ve built the infrastructure to track users throughout their journey, the next step is connecting that journey to actual conversion events.
Conversions can take many forms e.g. a submitted form, a phone call, a live chat, or even something offline like a product demo or a signed contract.
The challenge is that tools like GA4 are designed to track digital events, not people.
It might tell you that a form was submitted, but it can’t tell you who submitted it or what happened afterward. And in B2B or high-value B2C contexts, that’s exactly the information you need.
With Ruler’s first-party data in place, every conversion can be tied back to the full pre-conversion journey.
When someone fills out a form or makes a call, that event, and all of the marketing interactions leading up to it, are sent to your CRM or internal systems. This means you can finally attribute leads and revenue to the campaigns, channels, and content that drove them.
3. Link marketing touchpoints to revenue
With those leads and their journey data sitting in your CRM, you now have the foundation to link marketing activities with actual business outcomes.
As leads progress through your funnel, the original touchpoints stay attached to their profile.
This gives you visibility into how different marketing initiatives perform across the full lifecycle.
You might notice that a Meta campaign drives a lot of conversions, but those leads never make it past the initial discovery stage.
Or you could find that a particular landing page consistently drives high-value leads, prompting you to replicate its messaging and structure elsewhere on your site.
With this level of insight, you can even push qualified leads back into your ad platforms to build custom audiences.
Instead of relying on generic retargeting strategies that often waste spend by targeting existing customers, you can create audiences based on actual lead quality and buying behavior.
For example, leads marked as “high value” in your CRM can be synced to Meta as a custom audience to attract more users who look and behave like your best customers.
4. Add Cost Data to Calculate ROAS Properly
Here’s where everything comes together. To get a true picture of ROAS (and ROI, LTV, and CPA), you need to bring in cost data from all your ad platforms and match it against real revenue outcomes.
Remember, ad platforms are incentivised to make themselves look good.
They don’t see what happens outside their own environments and often claim credit for conversions they didn’t fully drive.
This results in inflated ROAS metrics that obscure the real performance of your campaigns.
With first-party tracking and CRM attribution, you can cut through the noise.
By deduplicating conversions and attributing them to the actual touchpoints that mattered, you can calculate blended ROAS – a much more accurate metric that accounts for the full journey across platforms.
You can still use platform-level ROAS as a directional guide for spend, but by anchoring your measurement in real, deduplicated outcomes, your decisions will be much more grounded.
5. Account for hard-to-track and impression-based channels
Everything above works well when clicks are involved.
But what about impression-based channels like TikTok or Instagram video ads, or even offline touchpoints like events or TV?
These are often the hardest to measure but can play a significant role in influencing purchase behavior.
To capture their impact, we use a combination of first-party data, marketing mix modelling/ impression modeling, and incrementality testing.
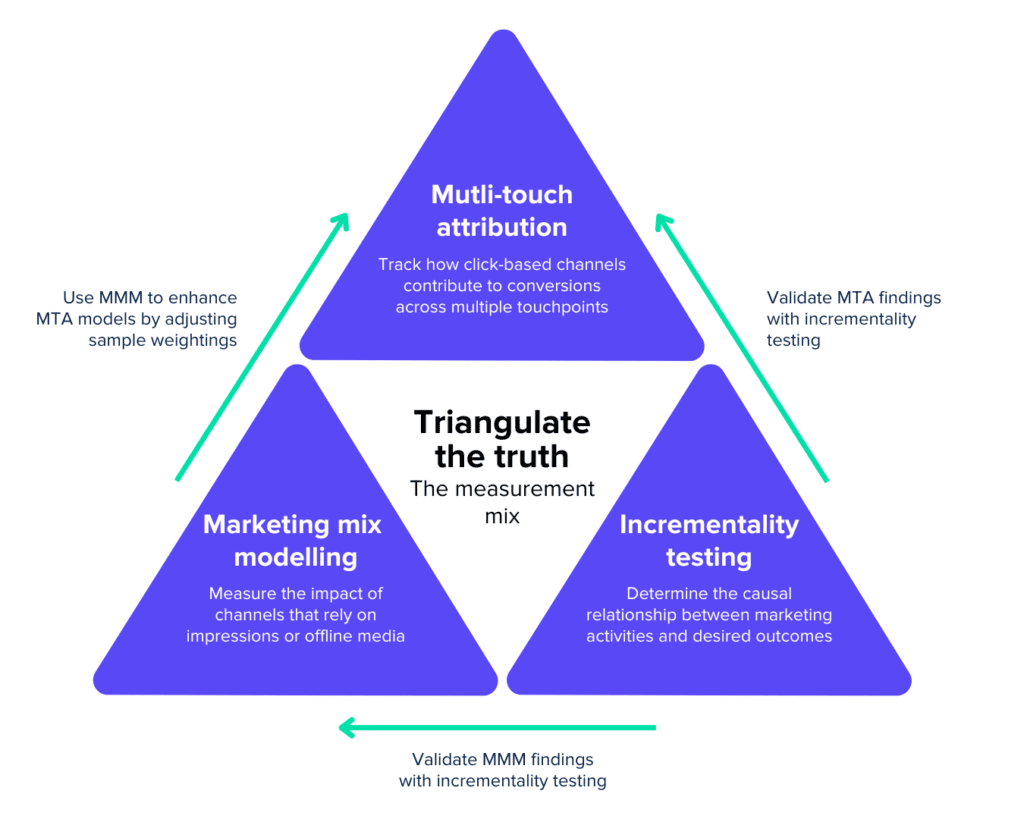
- Marketing mix modeling analyses the effect of various marketing inputs, like spend, seasonality, and promotions, on business outcomes such as revenue. It uses aggregated data and advanced statistical techniques like multivariate regression to model full-funnel activity across both online and offline channels.
- By combining MMM with click-based attribution, we can build a hybrid model that gives credit where it’s due – whether a user clicked, viewed, or simply became aware.
- To validate these models, we use incrementality testing, which functions like a scientific experiment. One group is exposed to a campaign, and another isn’t. Comparing their behavior helps determine whether a campaign actually drove incremental value or just captured demand that would have converted anyway.
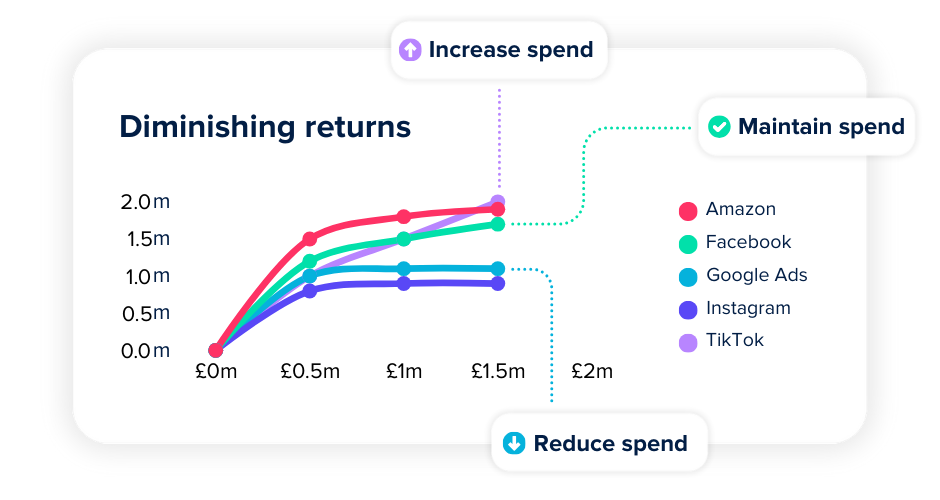
MMM also provides diminishing return curves, showing where additional ad spend begins to lose efficiency. This makes it easier to forecast future performance and make smarter budgeting decisions – especially when your previous plans were based on guesswork.
Need help tracking your ROAS?
Google Analytics is a useful starting point for understanding general trends in traffic and user behavior, but when it comes to measuring ROAS accurately, it has some major limitations.
The attribution is opaque, the data is anonymised, and the lookback windows are short.
Crucially, it can’t account for what happens after a lead submits a form or makes a call. That means you’re left with an incomplete picture of what actually drives revenue.
Sure, ad platforms like Meta and Google Ads will happily show you their own version of ROAS, but those metrics only reflect what happens inside their own ecosystems. The result? Overlapping credit, inflated results, and wasted ad spend.
Ruler pulls all your marketing, conversion, revenue and cost data into one place. It captures first-party data across the entire customer journey, ties it to real conversions in your CRM, and gives you a clear, unified view of what’s actually working.
You get deduplicated, cross-channel attribution that reflects real business outcomes.
If you’re ready to stop relying on black box attribution and start making smarter, data-driven decisions, book a demo and we’ll show you exactly how Ruler helps you track ROAS the right way.