
How to Optimise and Maximise your ROAS in 2026
We explain why platform ROAS misleads and how unified measurement restores confidence in marketing decisions.
ROAS looks simple on the surface. Spend money. Track conversions. Scale what works. In practice, it rarely behaves that way.
Today, most teams have more data than ever and less confidence in it.
Every ad platform reports strong performance. Budgets shift toward the channels with the highest ROAS. Revenue does not always follow.
The gap between reported results and real growth keeps widening.
This isn’t a problem with effort or execution. It’s a measurement problem.
This article explains why platform ROAS misleads, where attribution helps and falls short, and how unified measurement creates a more reliable way to optimise and scale marketing spend.
Here’s what we’ll be covering:
- What ROAS in advertising is
- Why platform-reported ROAS doesn’t reflect reality
- Hidden cost of Google ROAS
- Optimising ROAS with unified measurement
💡 Pro Tip
ROAS improves when you stop measuring channels in isolation. A unified approach reveals how demand is created, where spend saturates, and which investments drive incremental revenue. Ruler combines first-party multi-touch attribution with marketing mix modelling to support these decisions.
Book a demo to explore how this looks using real data.
What is ROAS in advertising?
Return on ad spend, or ROAS, measures how much revenue you generate for every pound you spend on advertising. If you spend £10,000 and generate £40,000 in tracked revenue, your ROAS is 4x.
Related: What is ROAS? Understanding return on ad spend
It’s one of the most widely used metrics in performance marketing because it appears to offer a direct link between spend and outcome.
ROAS is used to compare channels, campaigns, audiences, and creatives. Teams use it to decide where to increase budget, where to cut spend, and how to judge efficiency over time. In theory, higher ROAS means better performance.
The challenge is not the metric itself, but how it is calculated. ROAS depends entirely on what revenue gets attributed to an ad and how that credit is assigned.
Why platform-reported ROAS doesn’t reflect reality
Every ad platform is built to make itself look effective.
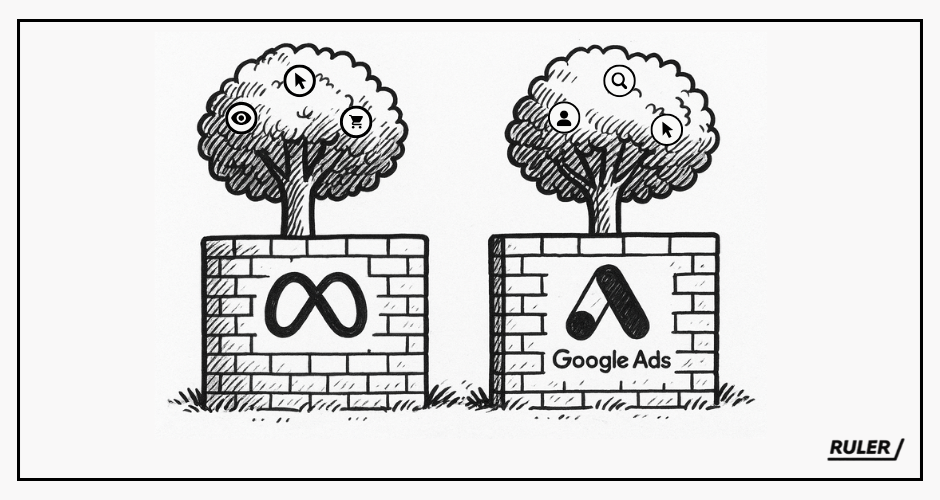
Google, Meta, TikTok, and others all track performance inside their own walls. They only see what happens in their ecosystem. They don’t see exposure, clicks, or influence from other platforms.
They also have no incentive to show you less credit than they can justify.
This creates a core problem: duplication.
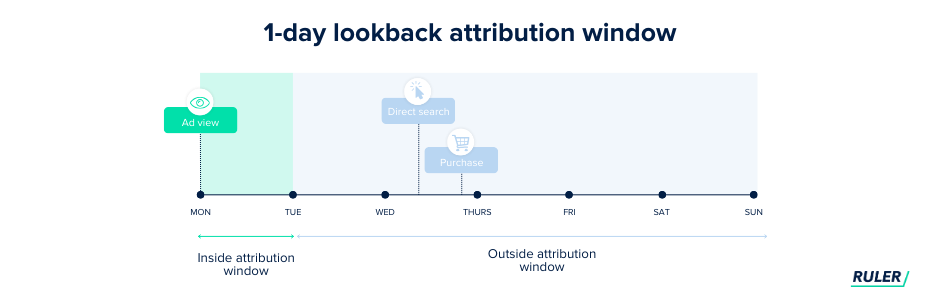
Each platform uses its own attribution windows and generous rules to claim conversions.
Google Ads uses a 90-day click window and a 1-day view window. If someone clicks a Google ad and converts weeks later, Google takes full credit.
Meta allows up to 28 days for clicks and 1 day for views. TikTok uses a 28-day click window and a 7-day view window.
Now consider a simple journey. A buyer sees a TikTok ad on Monday. They click a Meta ad on Wednesday. On Friday, they search your brand on Google and buy.
What happens next? TikTok claims the sale. Meta claims the sale. Google claims the sale.
Your reports show three conversions. Your business made one sale.
This is why platform ROAS never adds up. Each channel works in a silo and applies last-touch logic inside its own system.
The result is inflated performance and false confidence. When teams optimise using these numbers, they optimise against fiction.
Why Google Ads often gets too much credit
Duplication is only part of the problem. There is another trap that shows up in almost every account we review.
Many marketing teams spend 70 to 80 percent of their budget on Google Ads. Their reason feels logical.
Search is easy to track. Someone searches, clicks, and converts. Google often sits at the bottom of the funnel, where intent is clear. Its last-click model gives a clean line between spend and revenue.
The rest of the budget gets spread across Meta, TikTok, and similar channels. These platforms drive awareness and consideration, but their impact looks weaker in platform reports. Their ROAS appears lower, so teams trim spend or pause it.
Then growth stalls. Revenue stays flat or drops. The data looks confusing because Google Ads still shows strong ROAS. Conversions still fire. Reports still look reliable.
The issue is demand capture versus demand creation.
Platforms like TikTok and Meta create demand. They introduce the product, shape perception, and build memory. Word of mouth reinforces the decision.
By the time someone searches on Google, the choice is often made. Google closes the deal. It does not create the need.
Google Ads performs best when other channels feed it demand. When you cut those channels, fewer people search for your brand. Branded search volume falls. Over time, Google performance declines as well.
This is the cycle of misattribution. Teams optimise toward the channel that shouts the loudest. They cut the channels that drive growth. They trust ROAS numbers that overstate impact. Then they wonder why spend no longer scales with revenue.
Attribution isn’t dead, but it can’t work alone anymore
Attribution still matters. It just needs to be implemented with care.
The key condition is independence. Attribution only works when it sits outside ad platforms.
Platform reporting will always favour the channel doing the reporting. An independent attribution setup measures the full customer journey without bias toward any single network.
Third-party attribution tools can provide a more honest view of how people move through your funnel. They connect touchpoints across channels and apply one set of rules to all of them.
But, this doesn’t make the data perfect. Privacy limits still create gaps. Some interactions will never be visible. Even so, this approach is far more reliable than trusting platform-reported ROAS in isolation.
Attribution also has a structural blind spot: view-through influence.
Many customers don’t click ads. They see them. They remember them. Weeks later, they search for your brand, return directly, or convert through another channel.
In these cases, attribution records a Google click or a direct visit. It does not record the Meta, TikTok, or YouTube impression that shaped the decision.
This is why awareness and consideration channels often look weak in attribution models. Meta, TikTok, and YouTube influence behaviour without generating clicks. Google Search captures intent at the end of the journey. Click-based attribution measures actions, not influence.
Measuring and optimising ROAS requires unified measurement
When you measure channels in isolation, you create false winners and losers.
No channel works as a standalone growth engine. Paid social, search, video, and email perform best when they work together. One channel creates awareness. Another builds interest. Another converts that demand into revenue.
Measuring them separately hides this interdependence.
What matters is not which channel got the last click. What matters is incremental contribution.
And, your measurement approach needs to reflect this.
Attribution still plays a role here. It helps explain customer journeys.
Related: How attribution models have changed: Last-touch vs. multi-touch
It shows which touchpoints push people over the line. It supports fast decisions on creative, audiences, and bidding.
But attribution falls short in measuring upper-funnel influence, particularly impression-led campaigns, and understanding of how channels influence outcomes together.
To do that, it needs to be combined with marketing mix modelling and validated with lift tests.
Marketing mix modelling looks at performance from the opposite angle.
Related: What is marketing mix modelling? The future of marketing measurement
It analyses all marketing inputs together, like Google spend, Meta spend, TikTok spend, email, and more.
It then uses statistical regression to estimate how much each input contributes to revenue.
By controlling for these variables, MMM isolates incremental impact and answers the real ROAS question: what revenue would not have happened without this channel?
Where attribution zooms in on individual journeys, MMM zooms out to show a broader picture.
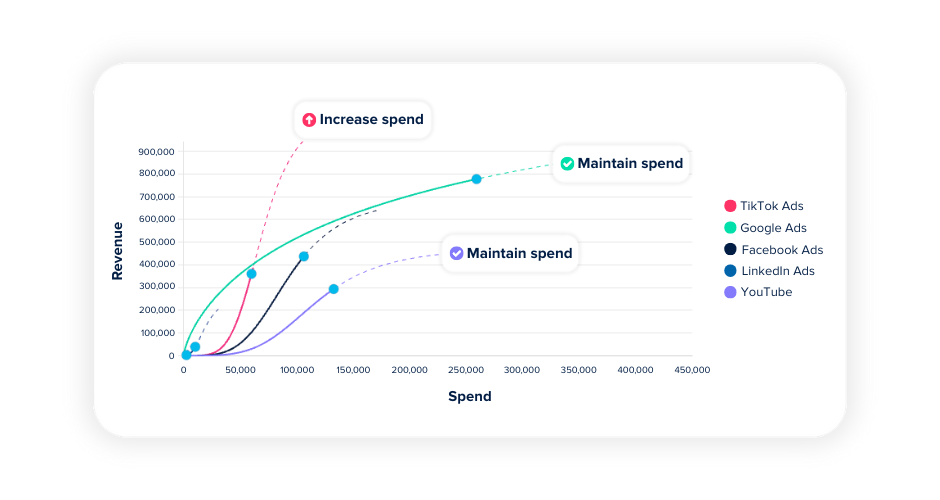
Its biggest advantage for ROAS is marginal insight. Every channel has a saturation point. Early spend reaches the most receptive audience.
Returns are strong. As spend increases, efficiency declines. You reach people who are less likely to convert. This is the law of diminishing returns.
MMM shows this curve for each channel. It reveals marginal ROAS, basically the return on the next pound spent, not the average return so far. This is the number that should guide budget decisions.
Related: How marketing mix modelling transforms budget planning
With an MMM tool like Ruler, you can test scenarios before spending anything. You can model what happens if you shift 20 percent of budget from Google to Meta.
The model predicts the revenue impact based on measured incremental contribution.
Instead of relying on instinct or partial attribution data, you make decisions grounded in statistical evidence.
💡 Pro Tip
See how Ruler models budget shifts before you spend. Book a demo to explore scenario planning, incremental contribution, and marginal ROAS using your own channel mix.
Why incrementality testing completes the picture
Attribution and marketing mix modelling both rely on observation. They analyse what happened and try to explain why. That has limits. Correlation does not prove causation.
Your Meta ads might be driving revenue. Or people who already planned to buy might have seen a Meta ad along the way.
Attribution and MMM cannot fully separate these two effects. They estimate impact, but they cannot prove it.
Incrementality testing does.
Incrementality measures what changes when a channel is added, removed, or adjusted. It compares exposed and unexposed groups to isolate cause and effect.
This makes it the only approach that can confirm whether a channel generated revenue that would not have happened otherwise.
Incrementality doesn’t replace attribution or MMM. It strengthens them.
For example, your MMM model might show TikTok delivering a 3.5x incremental ROAS.
You then run an incrementality test. If the test returns 3.2x, your model holds up. If it returns 1.8x, the model needs adjustment. The test gives you a benchmark to recalibrate your assumptions.
The same applies to attribution. Your attribution model might show Google Ads at 6x ROAS. An incrementality test might reveal the true figure is closer to 2.5x.
That tells you how much attribution is inflated. You can then apply a correction factor when using attribution for day-to-day decisions.
Used together, these methods answer different questions.
- Attribution tells you which touchpoints customers experienced.
- Marketing mix modelling estimates how much each channel contributed.
- Incrementality testing confirms the causal impact you can trust.
This combination turns ROAS from a reporting metric into a decision tool.
The future of ROAS measurement is unified
Optimising ROAS in 2026 means accepting a hard truth. No single metric or model can explain performance on its own.
Platform ROAS inflates reality. Attribution adds structure but misses influence. Marketing mix modelling shows the system but relies on assumptions. Incrementality proves causation but can’t run everywhere, all the time. Each method has limits. Together, they provide clarity.
The teams that scale profitably are not asking which channel “won” the conversion.
They are asking which channels drive incremental revenue, where spend is saturated, and what happens when budgets shift.
They measure demand creation and demand capture as one system, not competing line items.
Ruler combines multi-touch attribution and marketing mix modelling to give you that joined-up view of ROAS. If you want to see how they work together in practice, you can book a demo with the team and explore your data through both lenses.