Let’s talk about acquisition reports and their role in Google Analytics 4.
Important Note: Google Analytics is sunsetting Universal Analytics in July 2023 and replacing it with GA4 tracking. For this article, we’ll mostly be focusing on GA4 to ensure you have the most up-to-date information.
Google Analytics is the top choice of marketing analytics for many businesses.
Don’t take our word for it. 90% of marketers consider Google Analytics their go-to tool for marketing measurement.
And rightly so.
Google Analytics is free and offers tons of reports and metrics for tracking website and marketing performance.
One of the most useful reports in Google Analytics is the acquisition report.
But why is it important, and how can you use it to improve your marketing?
Let us show you.
In this article, we’ll discuss:
- What is an acquisition report in Google Analytics 4?
- Where to find acquisition reports in Google Analytics 4?
- What’s the difference between user and traffic acquisition?
- How to get more value out of your acquisition reports
What is an acquisition report in Google Analytics 4?
An acquisition report in Google Analytics 4 lets you identify where your website traffic comes from.
Acquisition reports are key for understanding which marketing sources (organic search, paid, referral) are most effective at acquiring new visitors.
Once you’re inside your acquisition report, you can dive deeper into your data with advanced segments to get a more granular look at how different marketing campaigns, ads, and keywords help visitors find your website.
All in all, Google Analytics acquisition reports offer tons of value for every business. With acquisition reports, you can:
- get an overview regarding the performance of each channel
- evaluate your user behaviour and gain important statistics behind engagement
- understand how audiences from different marketing channels interact with your site
- pinpoint your highest-converting marketing channels
- make better decisions to increase traffic and website growth.
Where to find acquisition reports in Google Analytics 4?
Chances are you have a general idea of where to find acquisition reports in Google Analytics, but let’s assume you’re starting from scratch.
To find your acquisition reports, open your Google Analytics property and navigate to the left sidebar.
Click on Reports and Acquisition.
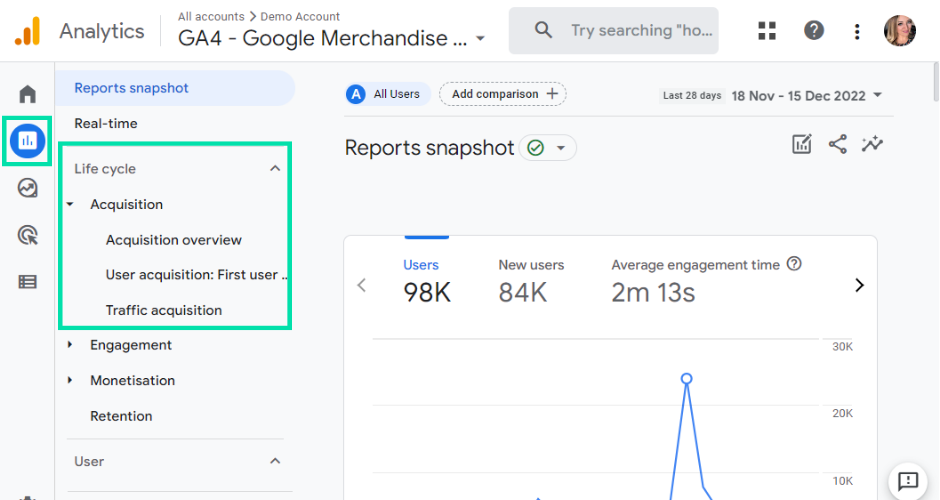
You should see the acquisition overview that gives you a breakdown of your site traffic by marketing channel and the following reports:
- User acquisition
- Traffic acquisition
And this leads us to the next section…
What’s the difference between user and traffic acquisition reports?
We know that Universal Analytics will be replaced by Google Analytics 4 in July 2023. And there are many changes in Google Analytics 4.
Related: What are the key differences between GA3 and GA4
Acquisition is one area that has undergone some significant changes.
In Universal Analytics, the acquisition report bundles your user and session metrics together and shows what source and medium campaigns have the greatest influence on website traffic.
While acquisition is still available in Google Analytics 4, the way your data is displayed is very different.
In GA4, acquisition is divided into two separate reports. These are user acquisition and traffic acquisition.
But what exactly is the difference between user and traffic acquisition?
Let’s start with user acquisition.
User acquisition is based on user engagement. It essentially focuses on the first source where you acquire your traffic and uses first-click to attribute conversion events.
Traffic acquisition works differently. It focuses on the most recent traffic source that led a visitor to your website.
Unlike user acquisition, the traffic acquisition report uses last-click to attribute traffic and conversion events.
Related: What is last-click attribution?
That’s why you will notice that dimensions in user acquisition start with “first_user” and dimensions in traffic acquisition start with “session”.
To explain the difference between user and traffic acquisition, it helps if we use an example.
Imagine for one moment Sara first lands on your website from a Google Search. Sara takes a look around your site but leaves.
Two days later, Sara returns to your website using the same device after clicking on a Facebook retargeting ad. During this session, Sara converts into a lead after filling out a form.
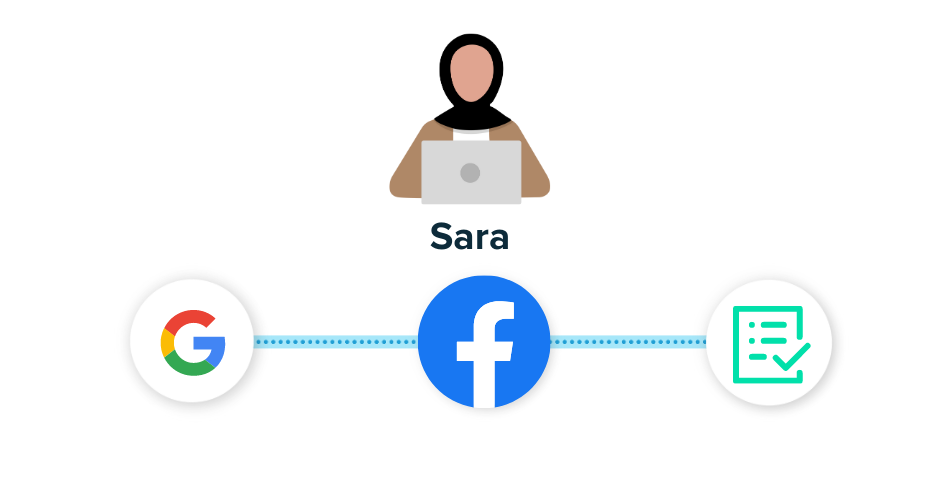
As you can see, we have two separate sessions. And your user and traffic acquisition reports will show different results.
User acquisition will attribute both sessions to Google as that’s the first source Sara came from.
However, traffic acquisition will report differently. It will attribute the first session to Google and the second session to Facebook.
That’s because traffic acquisition tracks your traffic sources of each session individually.
At this point, you’re probably wondering which one you should use for your reporting.
The short answer is: It depends.
It depends on what you want to know. If you’re interested in what brought your users to the site in the first place, your best bet is to stick with user acquisition.
But if you’re looking for a replacement for the Universal Analytics acquisition report, traffic acquisition is the closest thing you’re going to get.
How to get more value out of your acquisition reports
Acquisition reports in Google Analytics are some of the most meaningful reports for marketers.
They allow you to track which marketing sources generate the most clicks and conversions.
While acquisition reports have a lot to offer marketers out of the box, there’s still room for improvement.
Let us share a few quick tips to get more out of your Google Analytics 4 acquisition reports.
- Change the primary dimensions of your acquisition
- Customise acquisition reports with relevant metrics
- Enrich your acquisition reports with revenue attribution data
- Create your acquisition report in explorations
1. Change the primary dimensions of your acquisition
By default, your acquisition reports show how you acquire visitors to your site using various traffic sources (organic search, email, referral).
While it’s helpful to know what traffic sources drive visitor acquisition, it doesn’t provide much detail about your specific campaigns or ads.
Fortunately for marketers, Google Analytics 4 lets you customise your dimensions, allowing you to drill down into what is and isn’t working.
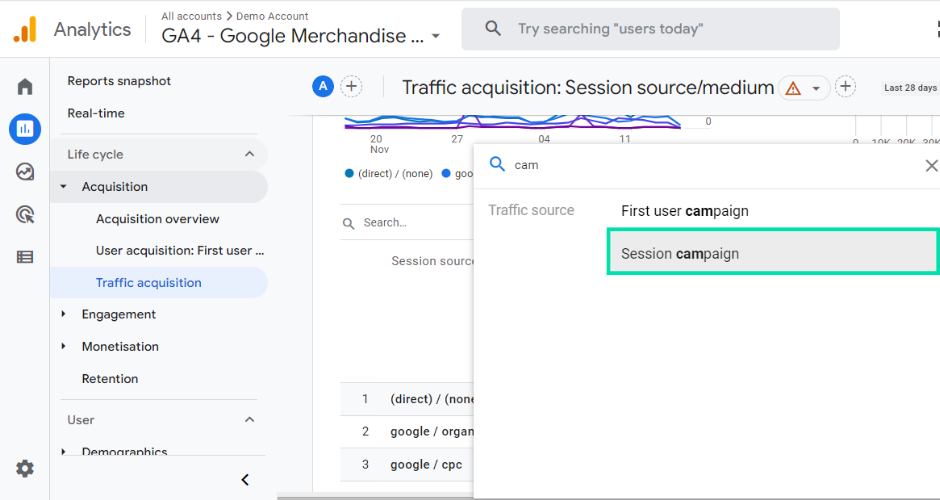
To customise your dimensions, click on the + icon above your acquisition report.
In this example, we’re going to find out what campaign has the greatest influence on conversions and revenue.
In the drop-down menu of a primary dimension, select Session campaign.
Your acquisition report should update to show a list of your active campaigns. Scroll across to see what influence your campaigns had on conversions and revenue.
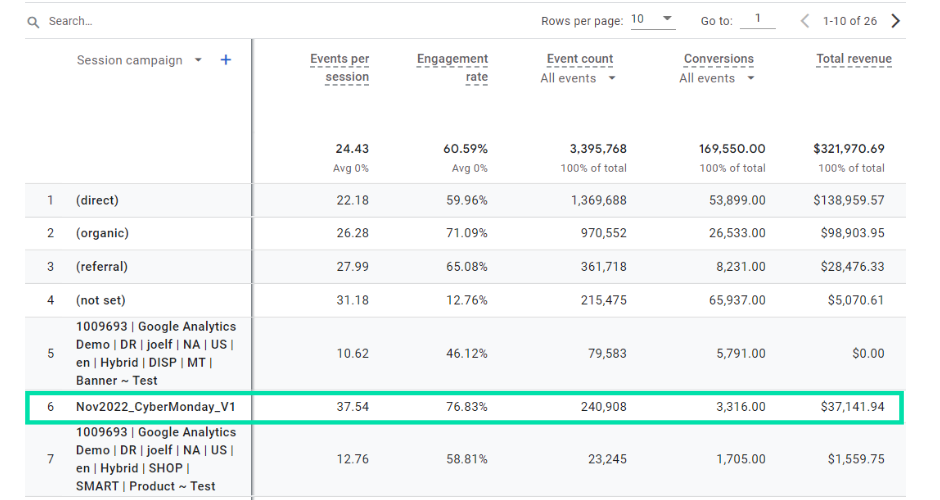
In our example, we can see that while “1009693 | Google Analytics Demo |” drove the most conversions, it was “Nov2022_CyberMonday” that generated the most revenue.
You can also repeat the process for:
- session source/medium
- session medium
- session source
- session source platform
If you want to see source/medium and campaign together, select session source/medium as the primary dimension. Click the + icon again, scroll down to Traffic source and select Session campaign.
If set up correctly, you should see a report that contains source/medium and campaign data.
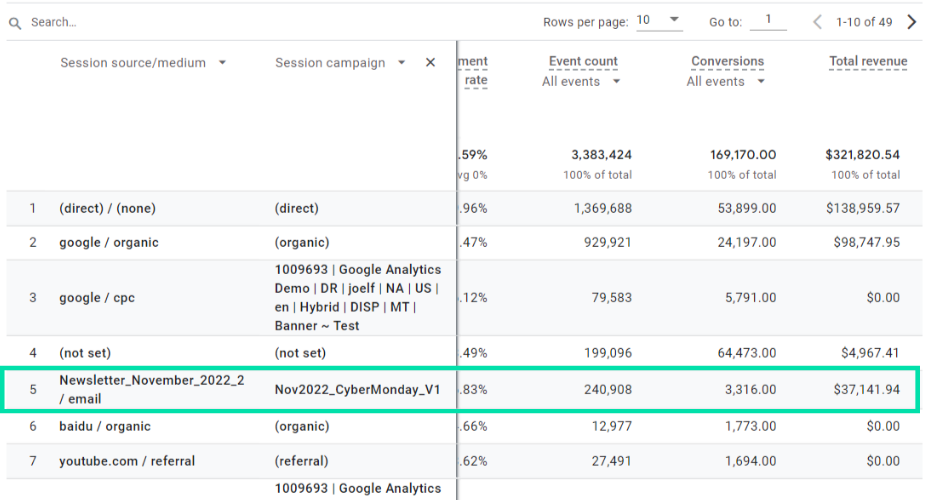
In the example above, you can see that “Nov2022_CyberMonday” was an email campaign. Seeing as this campaign had the greatest impact on revenue, it makes complete sense to invest more budget into this campaign and channel to get more for our buck.
2. Customise acquisition reports with relevant metrics
By default, the metrics available in both user and traffic acquisition are focused on users, engaged sessions, events and conversions.
This is fine if you want a basic overview of what’s happening on your website.
But if you want to dive deeper and truly understand how your traffic sources impact your website and business performance, you can customise your metrics.
To add and remove metrics, first click on the pencil icon.
Click on Metrics. Click X next to the metrics you find least useful. For additional metrics, scroll down to the bottom of the list and select Add metrics.
Here you can choose from a list of metrics to better measure and monitor the performance and outcomes of your marketing efforts.
You can also change the order of your metrics by using the drag-and-drop option.
Once you’re happy with your selection of metrics, click Apply.
Hit Save, and you should now see your custom metrics in your acquisition report.
3. Enrich your acquisition reports with revenue attribution
Google Analytics 4 can easily track your revenue if you sell products online.
All you need to do is add a bit of code to your website, and you can easily track which of your traffic sources drive the most sales and revenue in your acquisition reports.
Tracking revenue for leads is a little more tricky, especially for B2B marketers that generate leads with different revenue and lifetime values.
The issue derives from GA’s inability to track personally identifiable information about users.
Google Analytics can’t track the email, name or other personal information of a user that converts on your website. The best it can provide is an anonymous user id.
Related: How to track individual users in Google Analytics
But a user id isn’t going to get you far when you’re trying to pinpoint the traffic sources that produce your highest-converting customers.
Without this link, it’s impossible to track:
- where your leads came from
- far have your leads made it down the funnel
- how much your leads are worth in revenue
- where you’re getting the best ROI
Fortunately for marketers, there’s a workaround.
That workaround is revenue attribution tools.
Tools like Ruler Analytics, for example, can enrich your acquisition reports with revenue data for leads.
So you can see which traffic sources lead to the most revenue instead of relying on event and conversion data.
Ruler works by tracking every visitor to your website using first-party cookies. It tracks your visitors over multiple sources, keywords, ads, landing pages and more. When a user converts, it sends all the data captured to your CRM.
Related: How to view full customer journeys with Ruler
Here you can track where your highest-value leads are coming from and better assess marketing’s impact on pipeline generation.
Once a deal is won, Ruler will enrich Google Analytics with revenue attribution data, allowing you to get a better picture of your ROI and ROAS.
We have plenty of content on how Ruler enriches Google Analytics with revenue if you want to learn more.
4. Create your acquisition report in explorations
Google Analytics 4 has made it possible to create your acquisition report in Explorations.
This will allow you to go beyond GA4’s standard reporting to uncover actionable insights about your user and traffic performance.
And you can replicate your report in three simple clicks.
Go to either user acquisition or traffic users and click the Edit icon.
Your sidebar should appear. Scroll down to the bottom and click Explore.
And that’s it!
Your report is recreated as a free-form exploration. Now you can get to work creating different dashboards for multiple teams within your organisation.
Final thoughts on acquisition reports in Google Analytics 4
Google Analytics 4 provides tons of data about how your visitors land and engage with your website.
The acquisition report, in particular, gives you insight into which marketing sources bring in the most traffic and conversions.
It’s an essential report for any marketing expert looking to track and improve results.
The great thing about Google Analytics 4 is that it’s easily customisable and integrable. So you can include metrics and data that you find most important.
Don’t forget, Ruler integrates with your acquisition report so you can match revenue data against your traffic sources.
Instead of optimising for clicks and conversions, you can optimise for pipeline and revenue.
Learn more about how Ruler attributes revenue to your marketing and the benefits it can provide.