Analyse your campaigns the right way and make data-driven decisions to move your business forward.
Thinking analytically to scale marketing performance has always been a sought-after skill.
But, now, it’s non-negotiable.
Today’s marketers are responsible for more than just building campaigns to drive brand awareness and leads. Marketers also need to think like data scientists.
With budget cutbacks and unpredictable sales cycles, the ability to analyse data to inform future decisions is more important than ever.
Knowing how to perform a campaign analysis is key, as this will ensure that your marketing activities are relevant and timely to achieving your organisational objectives.
And in this blog post, we’re going to show you the best tools and techniques to help measure your campaign success.
Here’s what we’ll cover:
- What is a campaign analysis?
- How often should you analyse your campaigns?
- How do you write a campaign analysis?
- What tools can you use to perform a campaign analysis?
💡 Pro Tip
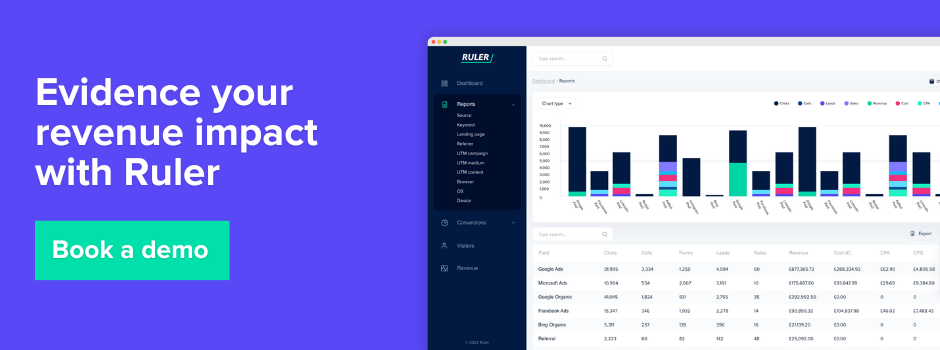
Ruler Analytics makes the process of tracking campaign performance much easier. It tracks data on a visitor level, allowing you to successfully attribute leads and revenue back to your campaigns across multiple touchpoints.
See how Ruler measures the performance of your marketing
What is a campaign analysis?
So that we’re all on the same page, let’s quickly explain what a campaign analysis is and how it works.
A campaign analysis is an assessment of your marketing performance. It’s a chance to showcase your campaign performance and validate your work to colleagues, clients and stakeholders.
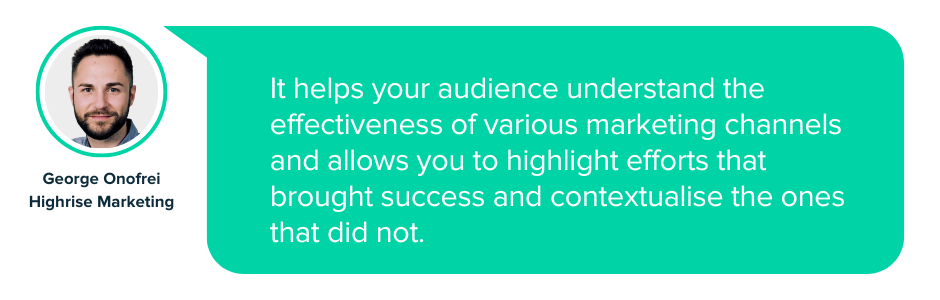
“It helps your audience understand the effectiveness of various marketing channels and allows you to highlight efforts that brought success and contextualise the ones that did not,” added George Onofrei, Digital Project Manager at Highrise Marketing.
Once you fully understand how to perform a campaign analysis, you’ll be able to:
- better understand the role your campaigns play in the overall customer journey.
- make data-driven marketing decisions to propel your campaigns to success.
- allocate budget towards your highest converting campaigns.
- gain more trust from your stakeholders or clients.
- request additional marketing budget to increase your reach and acquire more high-quality leads.
How often should you analyse your campaigns?
There isn’t a right answer to how frequently you should measure your campaigns.
How often you analyse your campaigns depends on your goals and what you’re trying to achieve with your marketing.
Related: How to measure the success of your marketing campaigns
However, when surveyed, 32% of companies reported that they track campaign success once a month, while 43% measure performance at least once a week.
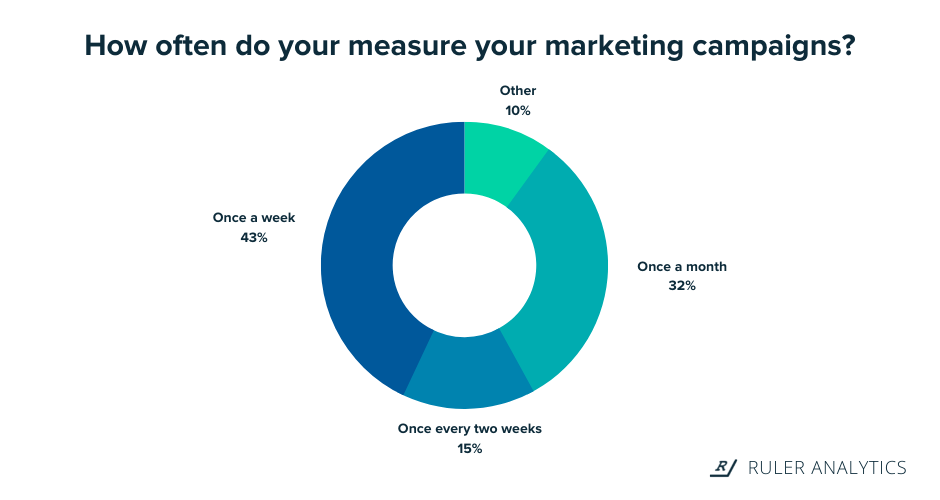
Nearly half of the people we surveyed measure and report on marketing effectiveness at least once a week, and with good reason too.
Reporting daily or weekly lets you stay on top of any opportunities or issues that may suddenly arise. You can make quick changes to your marketing to help keep it current and efficient.
Related: A complete guide to digital marketing reports
Though some campaigns make sense to track more frequently, spending time explaining results each week can turn into a lengthy process.
In fact, 75% say they spend too much time reporting on marketing.
And it’s for this reason that 32% of marketers likely opt for monthly reporting to analyse their campaigns.
Monthly reporting is less time-consuming, which means increased productivity and performance.
More importantly, “showing month-on-month performance or even longer time periods will prevent an over-focus on, and knee jerk reaction to, granular changes in measurables,” says Duncan Heath, Strategy Director at Fresh Egg.
Both weekly and monthly reporting have their benefits, but whatever you choose, make sure it’s manageable and relates back to your goals.
How do you write a campaign analysis?
A good campaign analysis demonstrates the value of your marketing efforts and proves why it’s a worthy investment.
There are many ways to produce a campaign analysis, but here are some things you should take into consideration.
- First, consider your audience
- Lead with an executive summary
- Make a list of goals and objectives
- Include a date comparison table for metrics
- Create a list of completed actions
- Add your next steps moving forward
- Compile a glossary to define key terms
1. First consider your audience
Before you even think about producing a campaign analysis, you need to consider who it is you’re reporting to and what matters most to them.
Aliesha Christopher, Digital Performance Analyst at DWP Digital, agrees: “It’s important that reports are tailored to individual clients’ needs.”
What one person cares about may not matter to another.
For example, your hands-on marketing team may want to understand how bounce rate is fluctuating, but your board will want insights into high-level indicators.
Asking your recipients about their business goals and how important they are is usually a good way to go.
By considering the goals and core values of your readers, you can cut through the noise and produce a campaign analysis that lives up to their expectations.
2. Lead with an executive summary
“We always start with a written summary. We’ll summarise key stats and results, then move onto highlighting what we’ve been doing in the previous month plus any interesting news or updates clients need to be aware of,” says Paul Morris, Managing Director at Superb Digital.
An executive summary is a brief overview at the beginning of your campaign analysis.
Ideally, you should start your campaign analysis with an executive summary. It helps grab the reader’s attention and summarises critical information about your marketing performance. It also allows you to add context to your numbers so that readers can understand what’s happening without having to delve into the numbers themselves.
A lot can happen in an allocated time frame. And highlighting your performance using a summary is a great way to entice your recipients to read on and learn more.
3. Make a list of goals and objectives
It’s easy to get side-tracked and lose focus on the end result when there is so much going on around you and so many channels to choose from.
Related: How to choose the most effective marketing channels
Highlighting your goals and objectives in your campaign analysis is a great way to stay focused and prioritise the marketing channels that are most valuable to your company.
On top of that, listing your goals and objectives in your campaign analysis allows everyone reading it to understand why you are doing what you are doing.
Ted Parry, Director at Amore Digital, believes: “One of the biggest mistakes marketers are making is sending off complex reports to their clients or leadership without providing any background.”
4. Include a date comparison table for metrics
“All our reports include details on how we’re doing compared to the previous month, year, and against forecast. This overview allows clients to quickly see how well a campaign is doing, whether it be focused on sessions, page views, enquiries or revenue,” says Victoria Foster, Head of Digital at Champions UK plc.
Comparing your performance data with a previous period is a great way to show your clients or stakeholders how valuable and worthy you are to their business.
As we’ve already discussed, most marketers prefer to track and analyse their marketing performance weekly.
This is perfectly acceptable if your business isn’t significantly affected by any seasonality factors.
But if your business sees an uptick in sales or revenue during particular times of the year, you might want to think about adding an annual benchmark to your campaign analysis.
Beckie Brown, Paid Search Lead at B&Q, explains: “For a business who doesn’t really experience seasonality, to compare how sales are increasing month on month is likely a good indicator of growth. However, if one of the busiest times of the year is during your Black Friday sale, it’s highly likely October will look pretty rubbish compared to November.”
5. Create a list of completed actions
“We include a summary page of the deliverables completed with the next steps to record the work that has been completed,” says Hardeep Matharoo, Head of Digital Marketing at Best Response Media.
Your stakeholders or clients will be eager to know what you have been doing with your time.
Outlining the work you’ve carried out will allow your readers to see how you’ve worked effectively towards your goals and objectives.
This doesn’t require too much detail. Just a couple of bullet points of what you’ve been up to should do the trick.
6. Add your next steps moving forward
At this point, your readers will want to know what steps you’re taking next to improve your performance.
Highlighting your next steps demonstrates dedication to your growth objectives and shows your ability to use data to develop your marketing strategy for better results.
“Providing the next steps allows you to demonstrate you’re being proactive in addressing any problems in performance by showing what you’re going to do to make improvements,” added Mindy Gofton, Head of SEO at Own Your Space.
Decide if you’re going to pivot or persevere with marketing tactics and give reasons why. It’ll help to round out and future-proof your campaign analysis.
7. Write up a glossary to define key terms
The best campaign analysis is engaging, personal, and jargon-free.
Amy Wilkinson, Co-Founder of Disruptive Thinking, suggests that you should always aim to “make your reports jargon-free while satisfying the level of data that the marketing team needs.”
At times, it’s impossible to avoid industry-related language, especially when it comes to marketing measurement.
That’s why it’s worth adding a glossary to your campaign analysis to describe and specify any marketing-related terms.
Doing this will allow your readers to follow your campaign analysis without getting lost in the woods.
“We always make sure to include a short glossary for clients to help them understand terms like CPM, impressions vs reach,” added Maria Christoforidou, Senior CX Consultant at Huble Digital.
What tools can you use to perform a campaign analysis?
The steps above can help you write a successful campaign analysis, but this is just one step in a long path.
It’s impossible to produce a campaign analysis without knowing what is and isn’t working first, right?
There are many ways to measure and analyse a marketing campaign.
In fact, we’re inundated with many tools and data integrations that can show you which marketing channels are most effective at driving quality results.
Related: 10 marketing performance tools and software to consider
But, with so many solutions promising to give you a single source of truth about what is and isn’t working, it can be tough to choose the right fit for your tech stack.
For us, however, we use the following tools to measure marketing performance and prove ROI.
- Google Analytics
- Google Sheets
- Insightly
- Ruler Analytics
1. Export campaign data from Google Analytics
First things first, we need to export our campaign data from Google Analytics.
We open up Google Analytics and navigate to Acquisition > Campaigns > All Campaigns.
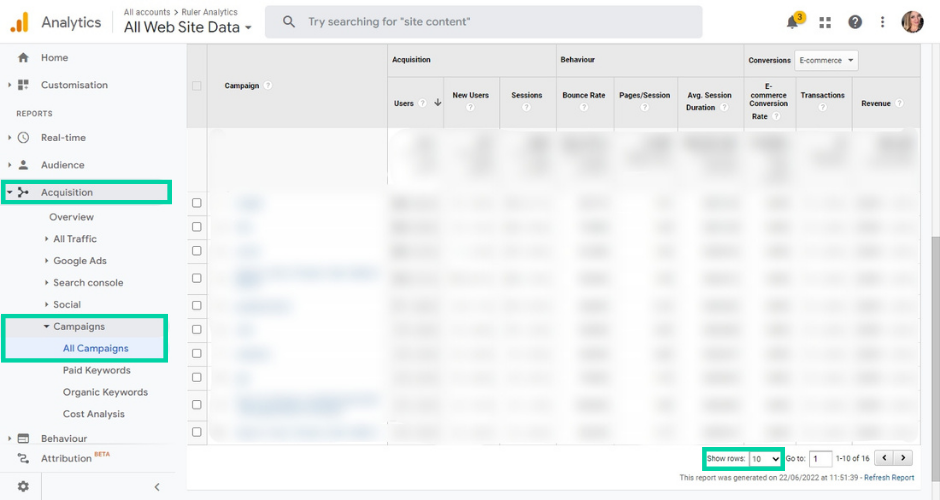
💡 Pro Tip
For GA4, the process would be a little different. Instead, we’d go to Acquisition > Traffic Acquisition. We’d navigate to the drop-down menu labelled “session default channel grouping” and would change this to “session campaign”.
The campaign data in Google Analytics gives us all the necessary web metrics we need to better calculate our demo and opportunity rate further down the line.
Related: 14 Google Analytics metrics for measuring marketing effectiveness
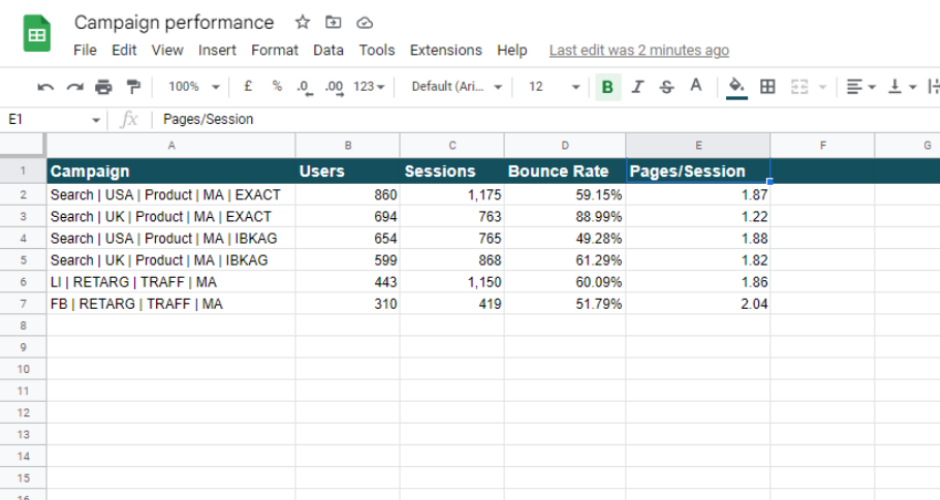
From the “Show Rows” drop-down menu, we select the necessary number of rows to display all our campaign data and then export the report to a Google Sheet.
Note: The numbers in this example are fictitious and are only used here as an illustration.
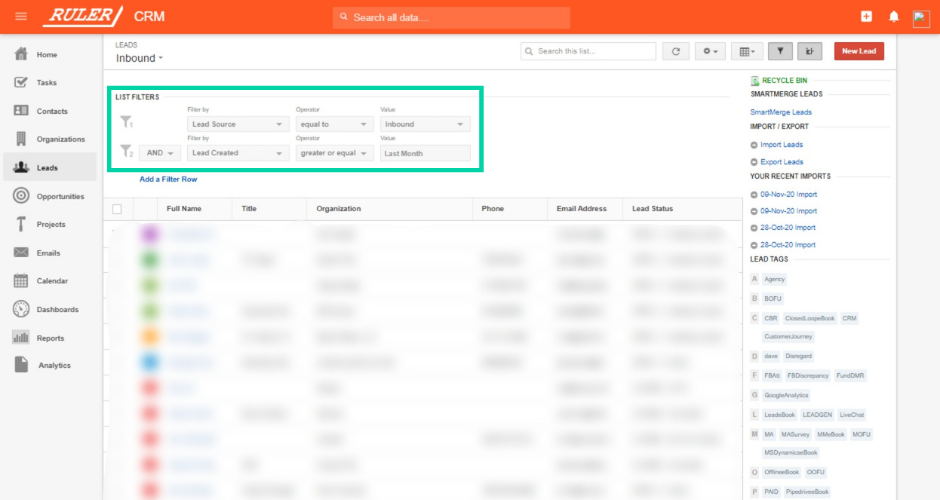
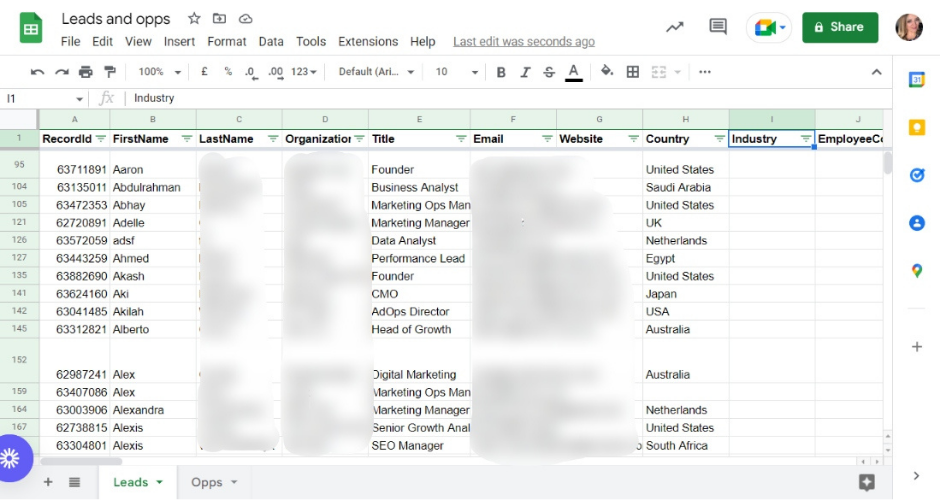
2. Export our leads and opportunities by month from Insightly
Next, we export our lead and opportunity data from Insightly.
For lead data, we navigate to Leads > Filter leads by last month > export to excel. To export our opportunities, we head over to “Opportunities” and repeat the same steps we followed for leads.
The thing about Insightly and other CRM tools is that they don’t offer much detail about where your leads or opportunities came from.
Most CRMs have a built-in “Source” field that allows you to map generic attributes to your leads and opportunities, such as Web, Partner, Word of Mouth, etc.
Related: How to send lead source to your CRM
And though handy to have, these generic lead sources don’t provide much information about the effectiveness of your marketing campaigns.
It’s for this reason that we use Ruler Analytics to track and analyse our campaign performance.
Ruler is an easy-to-use visitor-level marketing attribution tool that lets us get a full picture of our customer journeys.
It works by tracking each and every visitor over multiple sessions, traffic sources, keywords and more.
Related: How to view full customer journeys with Ruler Analytics
When a visitor converts and shares information about themselves, Ruler matches the lead with their previous marketing touchpoints and sends all this data to our Insightly CRM.
Now, you might be wondering why this is useful.
After all, there are tools like Google Analytics that use conversion tracking to assign leads and e-commerce transactions to your campaign sources.
Related: What is conversion tracking in Google Analytics
We’ll show you why.
Without Ruler, a lead record in Insightly would look something like this.
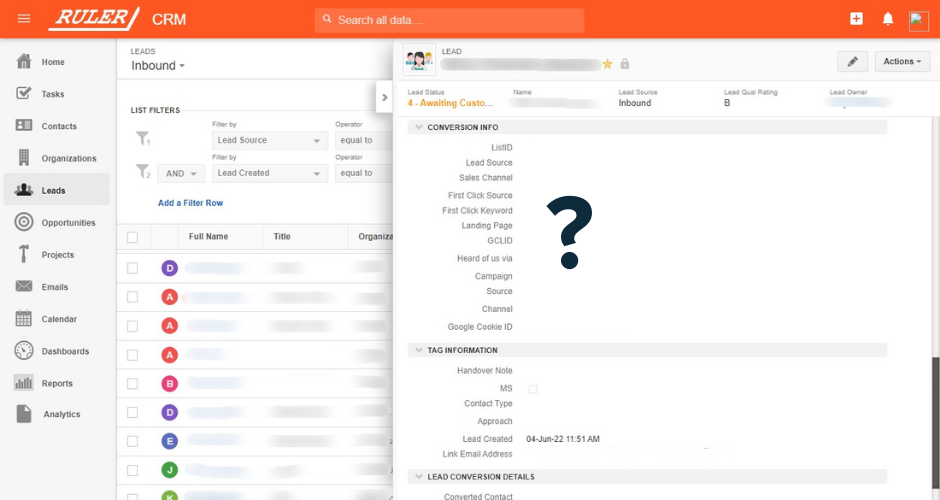
You can see the necessary contact details such as name, company and email are present.
But, there’s nothing about where the lead originated or what campaigns they engaged with before converting.
Now let’s use the same example but apply data from Ruler.
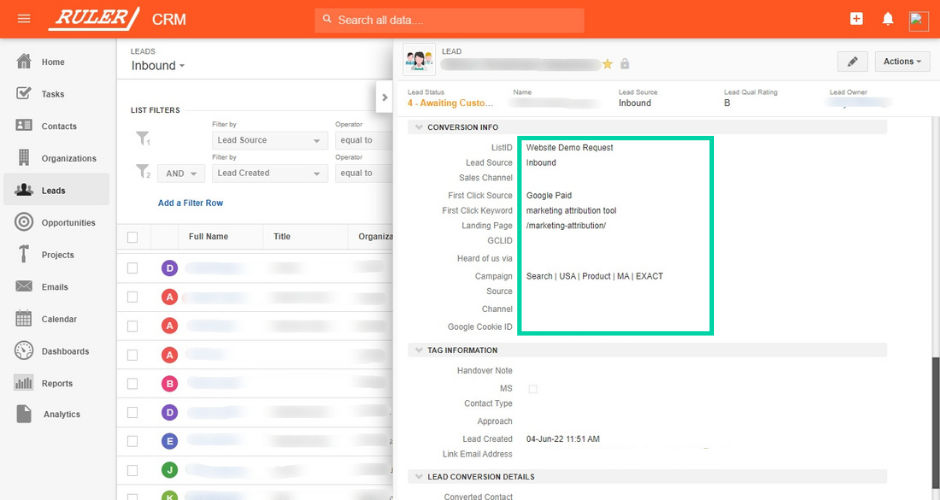
Using data from Ruler, we can see that this lead converted after viewing a Google Ad campaign and converted on our marketing attribution product page.
Big difference, right?
That’s not the best part.
With marketing source data attributed to our leads in Insightly, we can better analyse the effectiveness of our marketing campaigns at every stage of the sales pipeline.
We can see which marketing efforts are most effective at driving opportunities and won deals and make more informed decisions to scale up our campaign performance.
“Ruler helps us bridge the technology chasm between web, phone leads and direct facing sales, so that our dialogue can include customer-friendly metrics such as, “quotes accepted” and “services revenue agreed” and bind these to the detailed digital marketing tactics of paid clicks from Google, Facebook or LinkedIn,” added Chris Price, Founder at Ark Advance.
💡 Pro Tip
We have plenty more content on how Ruler can help optimise your marketing strategy. But if you want to cut to the chase and see it in action, your best bet is to book a demo and get a more in-depth look at how it works.
Book a demo of Ruler
3. Match leads and opportunities with campaign data
Now that we’ve exported our data from Insightly, our next job is to match our leads and opportunities back to the marketing campaigns that drove the initial interest.
For leads, we highlight all rows and create a pivot table.
For our pivot table, we select Rows > Campaign > Ascending.
Then, we select Values > Campaign > Counta.
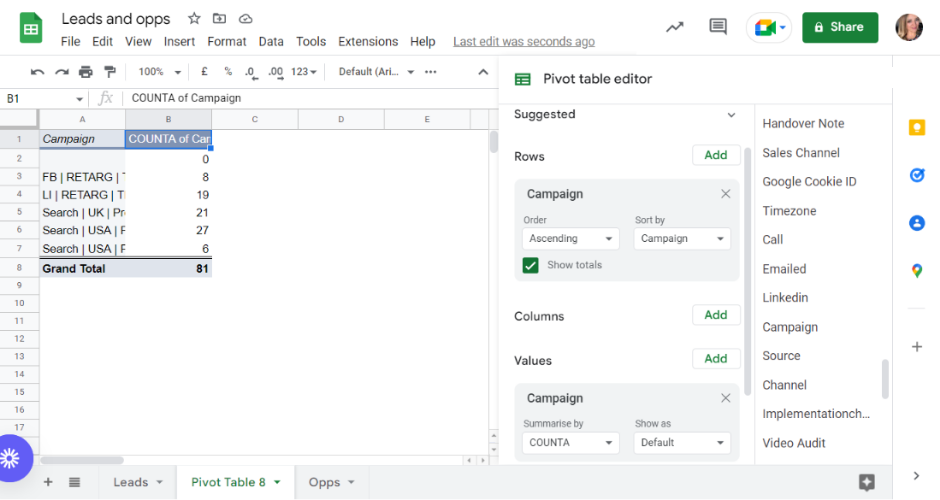
This should display how many leads each campaign has generated for our company. We repeat the same process for our opportunity data.
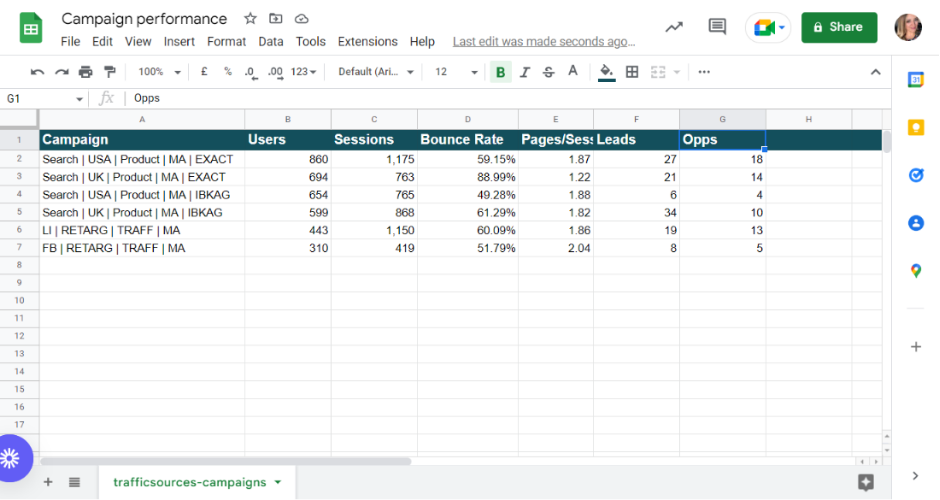
Once we’ve generated our lead and opportunity data, we input these numbers against our campaign data we exported from Google Analytics.
Note: The numbers in this example are fictitious and are only used here as an illustration.
4. Align marketing revenue with our campaign data
Tracking leads and opportunities is essential.
However, what we really want to know is how our marketing campaigns are influencing revenue.
To find out how much revenue each campaign has generated, we segment our “Won” opportunities for the month into a new separate sheet.
We create a pivot table and follow the same steps we used for leads and opportunities: Rows > Campaign > Ascending.
But, once we get to Value, instead of selecting “Campaign“, we choose “BidAmount“.
This shows us how much monthly recurring revenue each campaign has added to the pipeline.
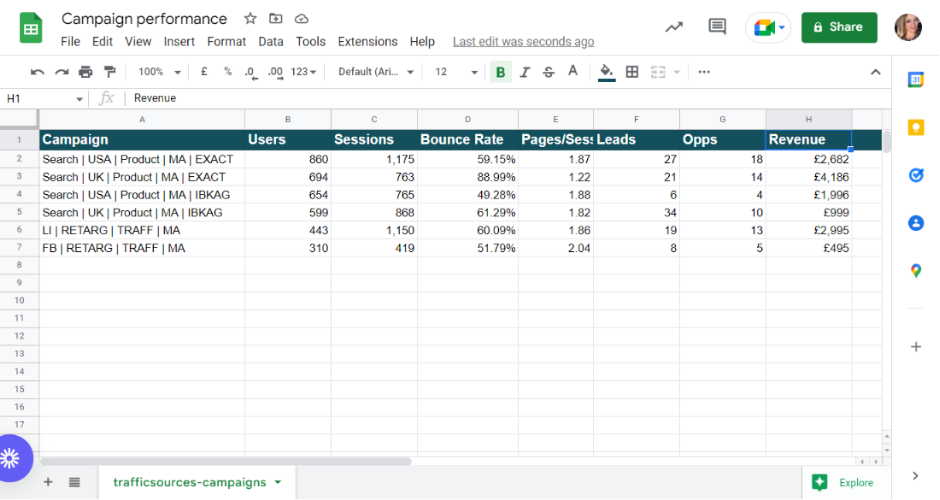
Once we’ve gathered this data, we add it alongside our web, lead and opportunity data in Google Sheets.
Now we can see the exact role our marketing campaigns played in driving leads and revenue for our company.
Note: The numbers in this example are fictitious and are only used here as an illustration.
Related: How Ruler attributes revenue to your marketing
Instead of optimising for clicks and conversions, we optimise for revenue.
And by focusing on revenue attribution and pipeline creation, we’re now attracting customers that have lower churn rates and higher customer lifetime values.
Need help producing your campaign analysis?
We hope you’re feeling more confident about approaching your next campaign analysis.
When it comes to tracking and analysing your marketing campaigns, Ruler is a must-have tool.
Using Ruler, you can dig deeper into your marketing performance data.
You can track how leads are converting into deals and attribute revenue to your most valuable marketing campaigns.
This will allow you to develop more useful insights and decisions that will lead to better results and outcomes.
We have plenty more information on how Ruler can help measure your marketing performance. Or, if you’d like to see Ruler in action for yourself, book a demo and speak with one of our attribution experts today.