Measure your landing page effectiveness and optimise for higher converting leads.
You’ve set your landing page live.
It’s driving visitors to your website.
Some visitors are converting.
But how does this relate to your goals or overall performance?
If you don’t know the answer, read on to learn more about the metrics, tools and strategies that can help better track your landing page effectiveness.
For this article, we’ll discuss:
Pro Tip
Ruler Analytics makes the process of tracking landing page performance much easier. It tracks data on a visitor level, allowing you to successfully attribute leads and revenue back to your landing pages across multiple campaigns, ads, keywords and more.
How to view full customer journeys in Ruler Analytics
Without measuring landing page performance, marketing teams wouldn’t have a clear picture of whether or not their strategies are a success.
Pretty simple, right?
Once you understand how to measure and analyse your landing page performance, you’ll be able to:
When you know which landing pages provide the best results, you can adjust your strategy to create similar and better-quality pages to attract higher converting leads.
Once you’re able to track down the topics that resonate best with your customers, you can allocate your budget more strategically to hire more people to help write similar content.
Knowing where your traffic is coming from is one of the most important aspects of a landing page analysis. It helps you understand which marketing efforts are working—or not.
If a particular landing page is performing well, you can assess which marketing channels are creating the most sessions and allocate budget to these areas to drive a higher marketing ROI.
While you want users to convert on your site, not every piece of content will achieve that goal. Some content is made simply to drive users while others are made to convert.
Efficiently tracking your landing page performance means you can see how each page performs and which category they fit in.
Generally, landing page metrics show how visitors interact with your website, including how they found it and whether or not they convert into a lead or sale.
Tracking the right metrics can help measure the success of your landing pages. It can also show how effective your marketing campaigns are at driving visitors and leads to your website.
Related: A guide to tracking the right metrics for your marketing
Let’s take a look at some of the most common metrics to track and measure your landing page effectiveness.
Landing page views display how many times visitors have viewed a specific landing page on your website. Generally, Google Analytics is the best way to track landing page performance.
Google Analytics offers powerful insights about your website’s visitors and how they interact with your landing pages.
Related: Complete guide to website visitor tracking
To find key insights about your landing pages, navigate to Behaviour > Site Content > All Pages. In the All Pages view, find the URL for your landing page, and click on it.
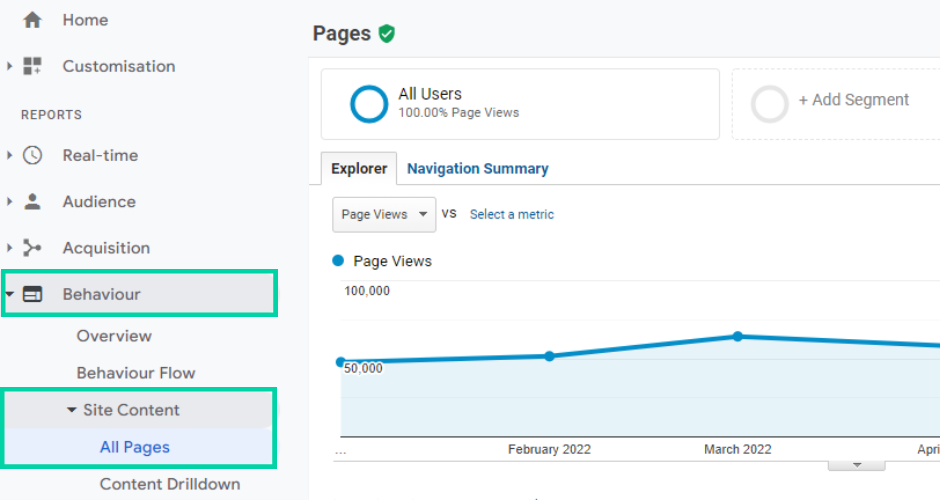
Using this report, you can analyse how well your landing pages are performing and track things like bounce rate, average time on page, entrances, percent exit, and page value (we’ll explain some of these metrics in more detail in a second).
This is a great metric for measuring the SEO performance of your site and how well users move down your content funnel.
Tracking conversions, or goal completions, is essential for you to monitor and understand the performance of your landing pages and marketing channels.
If you’re not tracking conversions, you’re throwing your money away.
That may sound drastic, but it’s the truth.
Related: Conversion tracking software and tools for 2022
Without conversion tracking, you’re unaware of what content, landing pages, and campaigns are influencing your visitors and potential leads.
With conversion tracking in Google Analytics, you can track the number of conversions for your landing page and where your visitors originated. To find this information, navigate to Conversions > Goals > Overview.
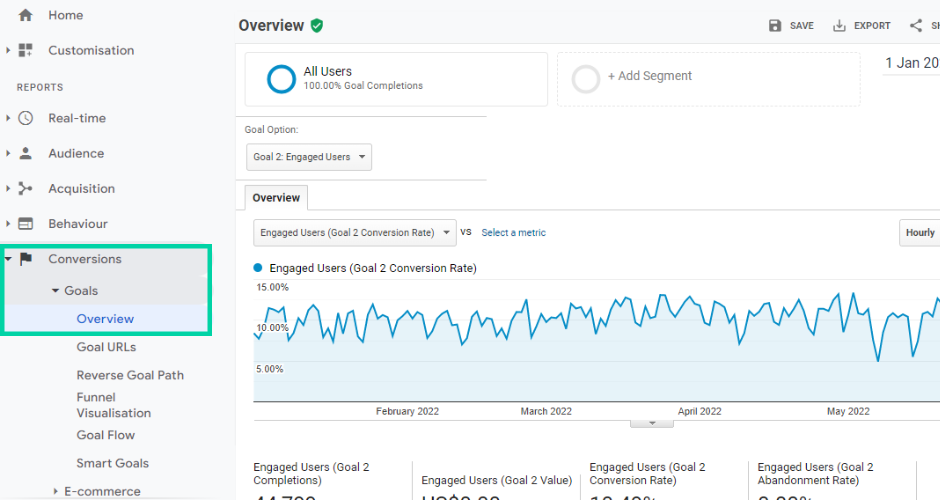
Using the drop-down list, you can select a goal to see your total number of conversions.
Pro Tip
Tracking conversions are the first step. You also need to be able to prove which channels impact pipeline generation. Ruler Analytics can track your full customer journeys, allowing you to go beyond conversion tracking in tools like Google Analytics to understand how your marketing channels impact opportunities and revenue.
How Ruler attributes revenue to your marketing
Another popular landing page metric is the cost per conversion or lead. If you’re running advertising, cost per conversion can show you how much it costs to acquire a new lead.
Calculating cost per lead or conversion is simple.
Related: Cost per lead: is your marketing effective?
Take the total cost of traffic generated to your page and divide it by the total number of conversions.
Knowing how much you are paying for leads can be helpful when optimising your landing pages and campaigns for better results.
Just be aware that cost per lead isn’t the end all be all when it comes to making important budgetary decisions.
We’ll explain why in a second.
Conversion value is a monetary number assigned to a goal, conversion or event.
Google Analytics, for one, can assign goal values to conversions and breaks them down by different dimensions, such as landing page and traffic source.
Related: How to assign goal values in Google Analytics
Setting a goal or conversion value is not the same as making revenue from an eCommerce transaction. It is a value you feel that a particular conversion or action on your landing page is worth.
Let’s say you’re offering SEO audits to other businesses for £99.
You set up a goal in Google Analytics that triggers every time somebody requests an SEO audit and add £99 to the goal value.
Every time somebody completes a goal, Google Analytics will assign that amount of £99, allowing you to track the value of your marketing channels and landing pages.
One thing about goal values in Google Analytics is that they’re not dynamic.
In other words, the value of a goal can’t be changed.
Let’s say somebody decides to convert into a customer after they’ve received your SEO audit. This action is now worth considerably more money to your business, right?
But, in Google Analytics, the value of your goal would remain at £99.
Average time on page essentially measures the amount of time spent on a single page by all users.
Tracking how long visitors stay on your landing page is key.
Average time on page is a good indicator of engagement. A high average time could indicate that users are interested in your content, products or services.
If your average time on page is low, however, it could be a sign that your marketing is pulling in irrelevant visitors.
Bounce rate tracks whether users are navigating onto your website and quickly leaving without making an action such as clicking a link or filling out a form.
It’s calculated by the total number of one-page visits divided by the total number of entries to a website.
In essence, the lower the bounce rate of your website, the better.
There are instances where a higher bounce rate is acceptable. For example, if your goal is to guide users to a singular page and convert via a form.
A high bounce rate could be a result of the following:
The difference between new and returning visitors is pretty self-explanatory.
New vs returning page visitors is a comparison of new users who have never been to your website versus users who have visited your website.
The ratio of new visitors to returning visitors can be very revealing, demonstrating the effectiveness of your landing page and marketing campaigns.
For example, if you have a higher number of returning users, it may suggest that your landing page is engaging and provides value to your visitors.
Pro Tip
Want more tips on how to measure your marketing performance? This guide will walk you through marketing measurement, the key marketing metrics you need to track and how to best measure them.
Download a complete guide to measuring your marketing
The metrics above provide a good starting point for your marketing and landing page measurements.
But these metrics aren’t sole indicators to measure landing page and marketing success.
While they’re useful to understand your website engagement, they tell you nothing about the monetary uplift generated by your landing pages and marketing efforts—which should be your main priority.
Take cost per lead, for example.
The main flaw of using cost per lead as a performance metric is its lack of ability to measure lead quality.
For a long time, cost per lead has been the main measure of landing page and marketing campaign success.
With good reason too.
Cost per lead is easy to calculate and makes your reports look more successful.
But the truth about cost per lead is that it doesn’t tell you the full story.
So your landing page drove 100 leads last month.
How does that relate to your overall business growth?
Where did those leads end up in the pipeline? Did they close into revenue? Or did most of your leads fall at the opportunity stage?
To create high-quality landing pages and optimise them in ways that will attract and convert high-quality traffic, marketers need to shift their focus towards pipeline generation.
Instead of focusing on engagement and lead conversion metrics, marketers must take note of how their landing pages impact opportunities, average deal size, revenue and customer lifetime value.
And it’s exactly what we’re going to cover next.
At Ruler, we receive a lot of our inbound leads via our blog.
So, for the next part of this article, we’re going to show you how we connect our web pages directly to opportunities and revenue using the following tools.
First things first, we need to export our web page data.
To do this, we use Google Analytics.
We open up Google Analytics and navigate to Behaviour > Site Content > All Pages.
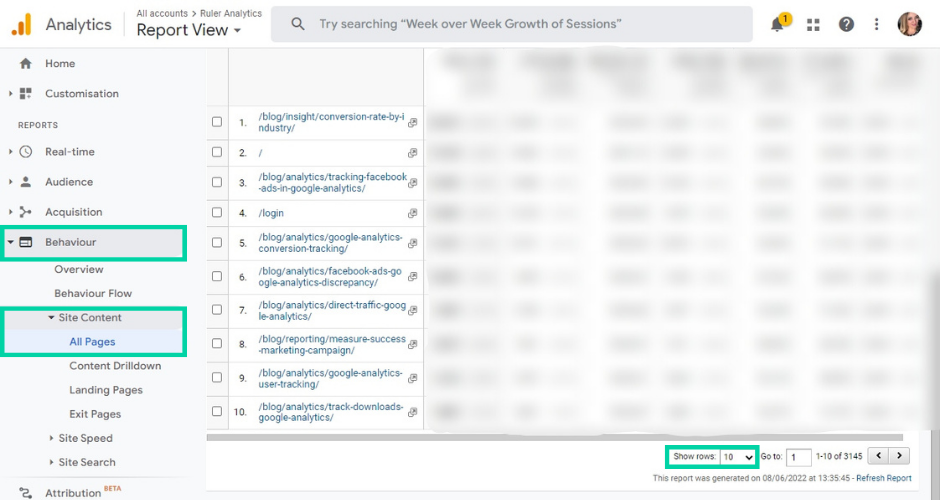
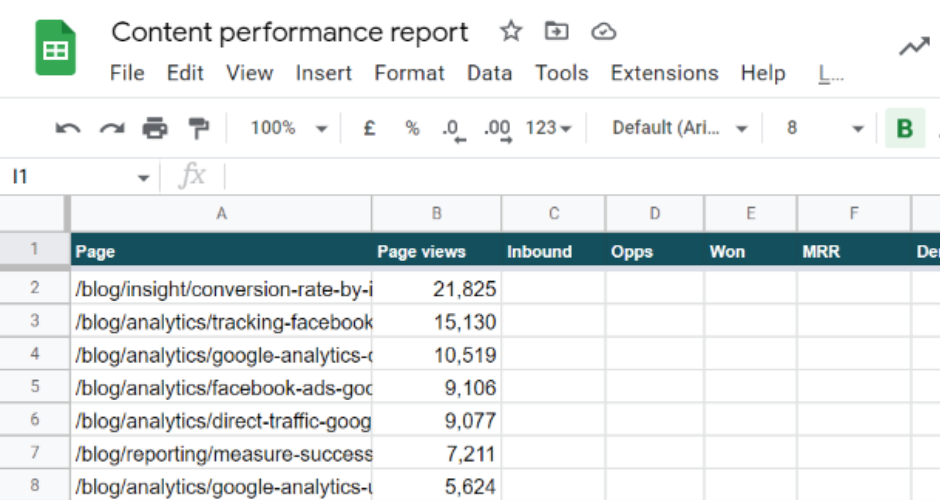
This report gives us all the necessary metrics we need to better calculate our demo and opportunity rate further down the line.
From the “Show Rows” drop-down menu, we select the necessary number of rows to display all our web pages and then export the report to Google Sheets.
We then copy and paste this data into a new sheet in our overall reporting document.
Note: The numbers in this example are fictitious and are only used here as an illustration.
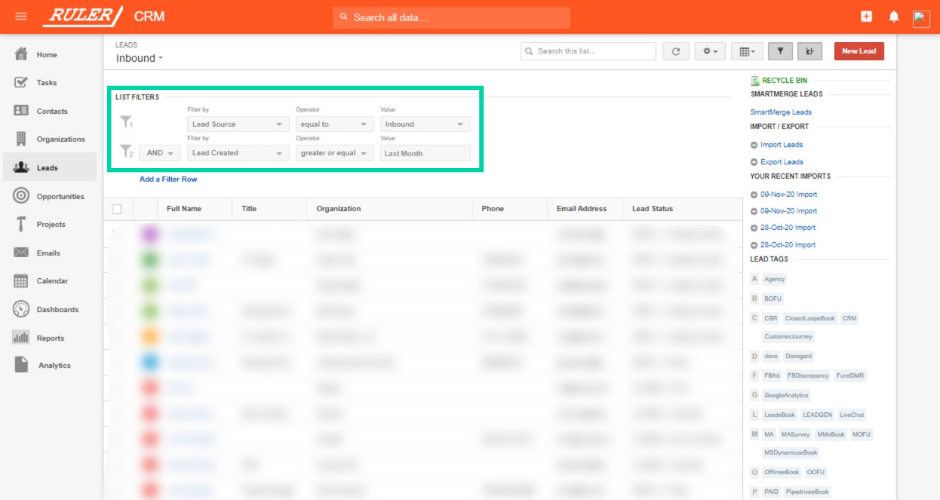
Now we need to export our leads from Insightly.
We navigate to Leads > Filter leads by last month > export to excel.
And this is where Ruler Analytics plays a significant role in this step-by-step process.
Without Ruler, a lead record in our Insightly CRM would look something like this.
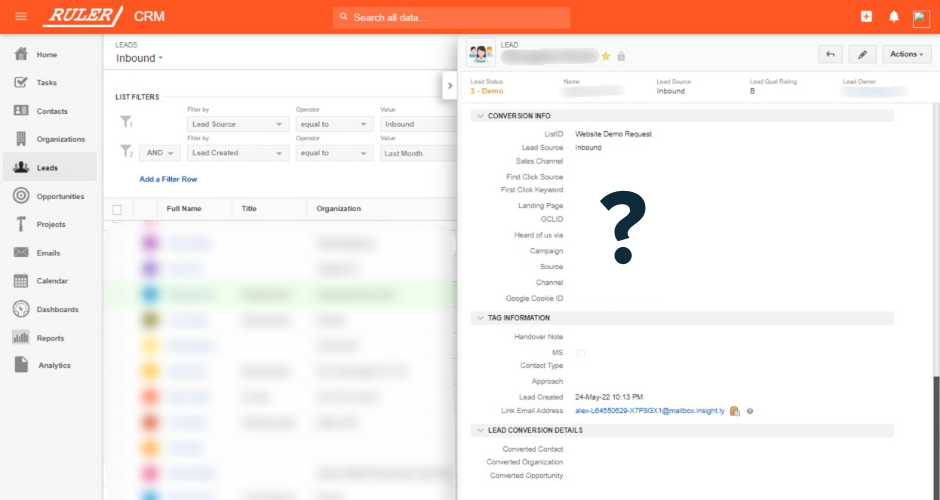
You can see that the necessary contact details such as name, company and email are present.
But, there’s nothing about where the lead originated or what pages they looked at before converting.
It’s for this reason that so many marketers struggle to track their marketing impact on pipeline generation.
There’s a massive gap in their data.
Most marketers are using tools like Google Analytics to capture marketing data. The issue with relying on Google Analytics is that the data is anonymised.
Out of the box, Google Analytics can’t track individual users, making the process of tracking leads across every touchpoint in their journey pretty much impossible.
Related: How to track individual users in Google Analytics
And that’s where the Ruler steps in.
Ruler tracks visitors on an individual level across multiple landing pages and marketing channels and can integrate with almost any CRM.
Related: Track where your leads came from with Ruler
Let’s revert to the example above. In the previous screenshot, we saw a lead in Insightly with no data on how they found our website or which landing pages they interacted with.
Applying data from Ruler, we can see that this lead converted after completing an organic search and converted on a blog around HubSpot lead tracking.
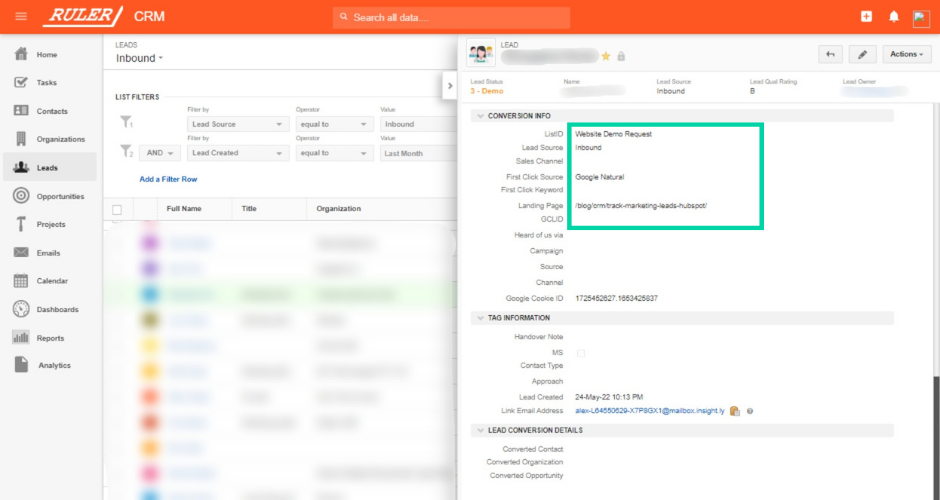
With marketing source and landing page data attributed to our leads in Insightly, the process of tracking marketing’s impact on revenue becomes light work.
As this lead continues to move closer to the finish line, we can analyse the effectiveness of our marketing campaigns and landing pages at every stage of the sales pipeline.
Goes without saying, but if we didn’t have Ruler, the process of measuring the impact of our landing pages on revenue would be unachievable.
Now that we’ve exported our data from Insightly, our first job is to match up our leads and MQLs back to the web pages that drove the initial interest.
First, we filter our spreadsheet by lead source and divide our MQL and lead data into two separate sheets.
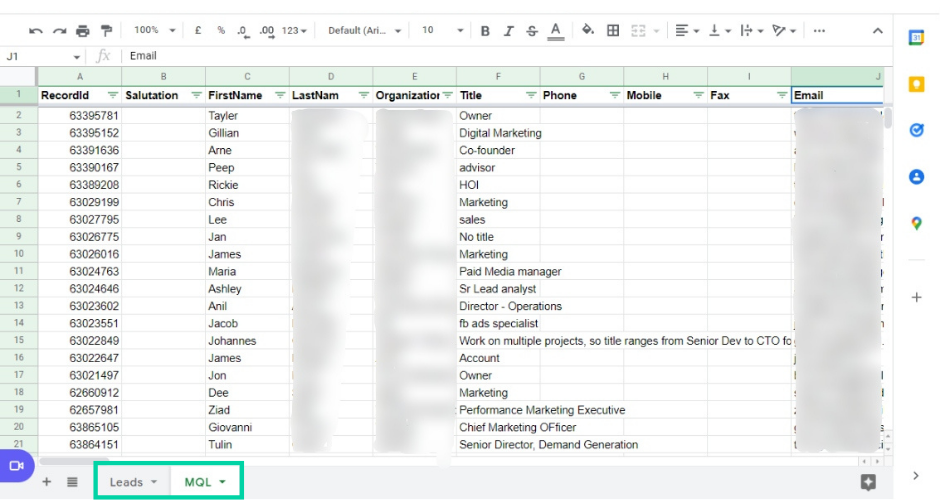
For this example, however, we’re just going to stick with leads.
We highlight all rows and create a pivot table.
For our pivot table, we select Rows > landing page > Ascending.
Then, we select values > landing page > counta.
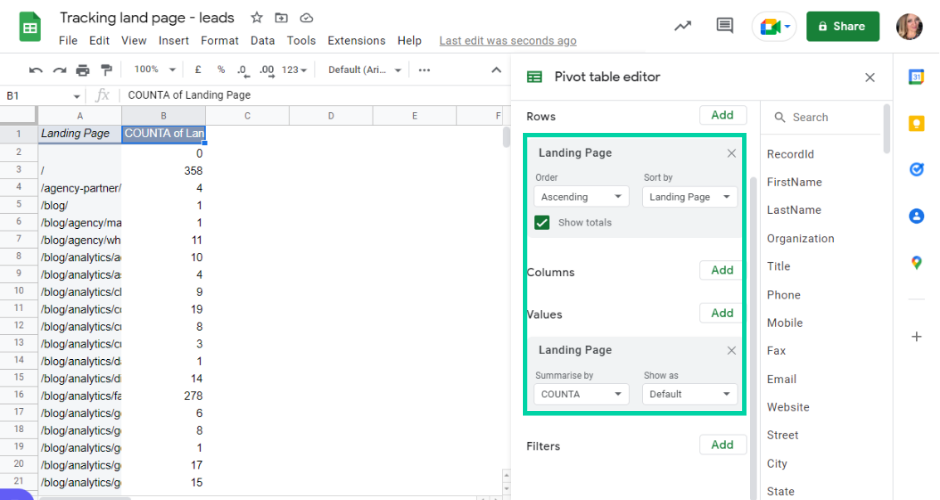
This should display how many leads each web page has generated on our website.
Once this data is generated, we input these numbers into our overall reporting document and would repeat the same process for our list of MQLs.
Note: The numbers in this example are fictitious and are only used here as an illustration.
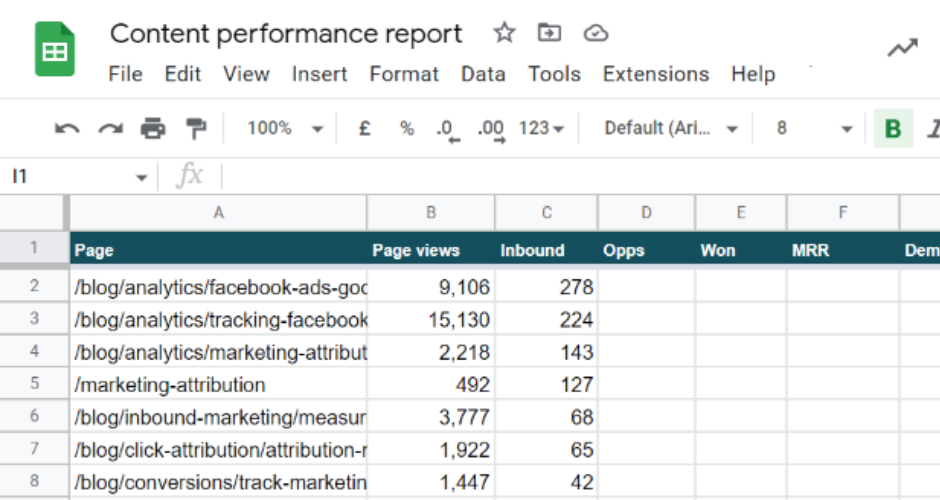
Leads are useful to track. But, the purpose of this step-by-step guide is to reveal what impact your landing pages have had on opportunities and revenue.
To achieve this, we need to head back into Insightly, and instead of navigating to “Leads“, we head over to “Opportunities“.
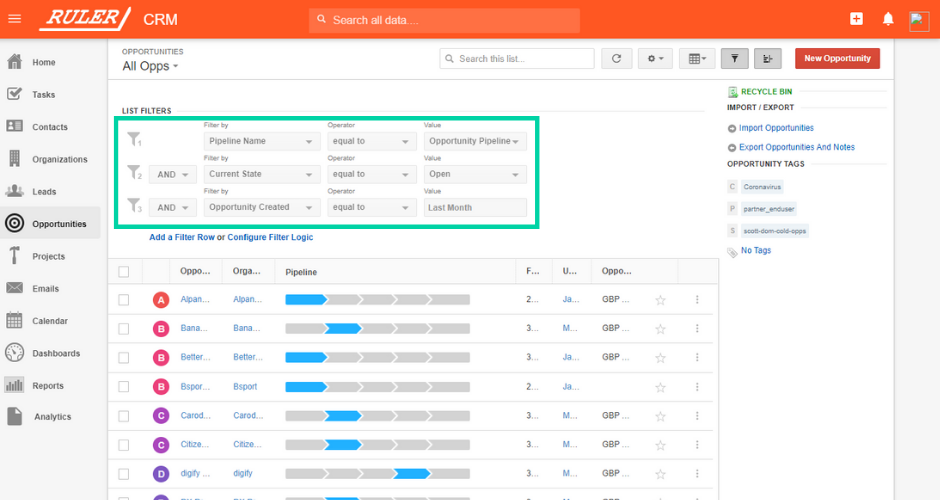
To match our opportunities with our web pages, we follow the same steps we used for our leads and MQLs.
We create a pivot table and select Rows > Landing Page > Ascending.
Then, we select Values > Landing Page > Counta.
This is optional, but you can filter out “suspended” and “disqualified” opportunities before you create your pivot table to ensure you’re focused on opportunities that actually make sense for your company.
Once you’ve matched your opportunities against your web pages, add this information to your reporting document alongside your lead data.
Note: the numbers in this example are fictitious and are only used here as an illustration.
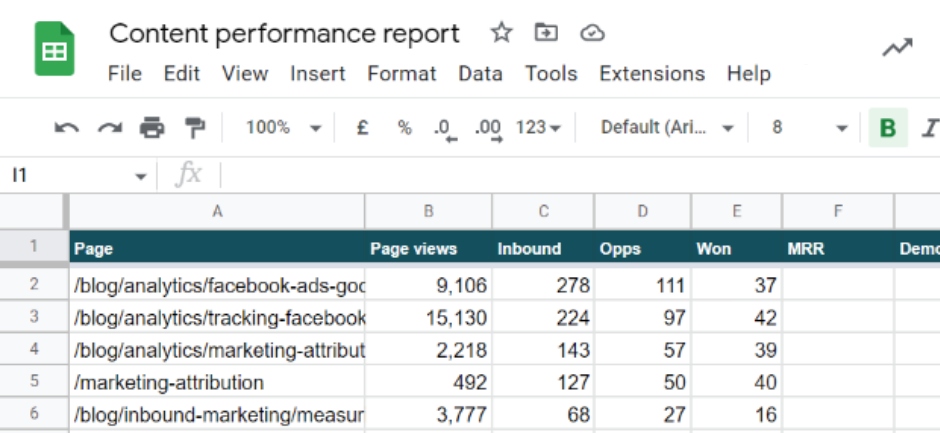
Now for the most important part.
To find out how much revenue each web page has generated, we segment our “Won” opportunities for the month into a new separate sheet. We create a pivot table and follow the same steps: Rows > Landing Page > Ascending.
But, once we get to Value, instead of selecting “Landing Page“, we choose “BidAmount“.
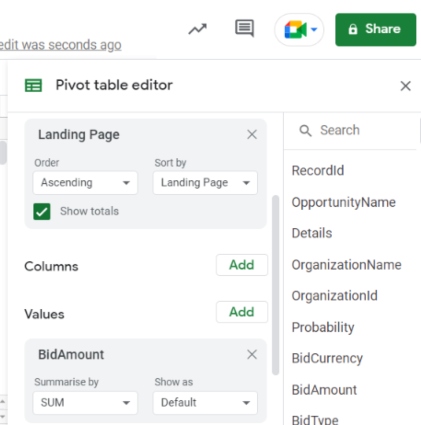
This shows us how much monthly recurring revenue each page on our website has added to the pipeline.
Again, we add this data to our overall reporting document, and if set up correctly, it should look like the example below.
Armed with this insight, we can build highly targeted plans for our marketing to achieve a greater ROI.
Note: The numbers in this example are fictitious and are only used here as an illustration.
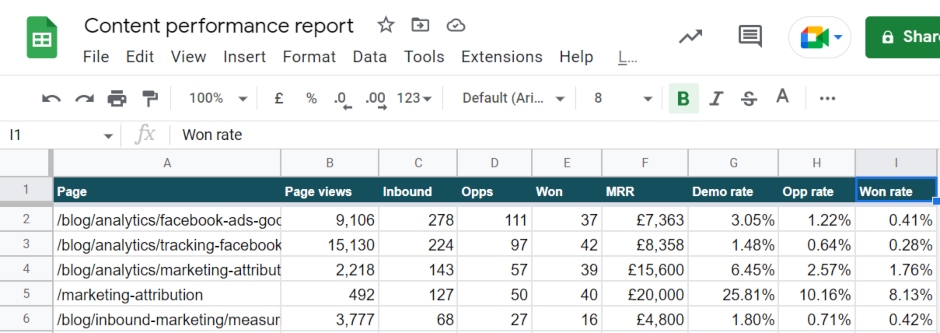
Instead of optimising our marketing based on leads, we can pinpoint the exact web pages that contribute to our highest-value opportunities and prioritise the topics that have proven to drive real business results.
We hope you’ve learned a little more about measuring your landing page success and the metrics you need to get started.
As a marketer, it’s in your best interests to figure out which landing pages drive the highest converting customers and revenue. With the right tools, metrics and strategy, you can highlight your landing page success and justify your value to the company.
Without tools like Ruler, we’d have no understanding of our landing page effectiveness and would eventually lose focus on what matters the most to our business.
For more great ways to measure your marketing effectiveness, download our complete guide on marketing measurement. Or, to learn more about Ruler, book a demo and see it in action for yourself.
