Most marketers turn to Google Analytics to track ROI, but is it truly reliable enough?
Measuring your ROI is the only way to know if your marketing is working. But ROI tracking isn’t simple, especially when several channels work together to drive new business.
Our data shows that 31% of marketers say proving ROI is one of their biggest challenges. It’s easy to see why.
Marketers in lead generation businesses often struggle to connect their activity to revenue. The challenge lies in linking data from a website visitor to a lead, and finally to a sale.
While tracking ROI is rarely straightforward, understanding the revenue impact of your campaigns helps you use your budget and resources wisely.
In this article, we’ll take a closer look at how to measure ROI in Google Analytics, and where its limitations lie.
How to track ROI in Google Analytics 4
Marketers often jump between Meta, TikTok, and Google Ads to understand performance and ROI. Each platform reports results differently and tends to take full credit for a conversion, leading to duplication and bias.
Google Analytics provides a more complete view across channels, helping you see where conversions and revenue actually come from. While it’s not flawless, which we’ll explain later, it’s still one of the most obvious places to start when measuring ROI.
Here’s how you can begin tracking ROI in Google Analytics:
1. Set up conversion tracking
To track leads or sales in GA4, you need to create a custom event and mark it as a conversion. There are two main ways to do this:
- Create a new event based on an existing one.
- Configure a new tag in Google Tag Manager.
Here, we’ll use the first option.
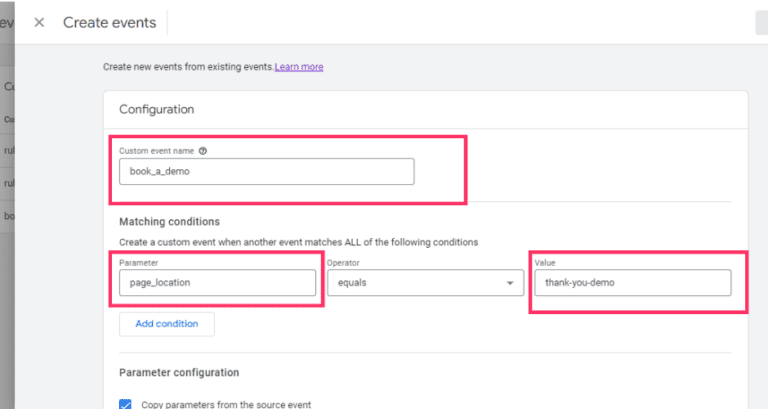
Let’s say you offer a free product demo. Users fill out a form and then land on a “thank you” page. You can trigger a conversion whenever someone views that page.
First, log into your GA4 property and go to Configure → Events → Create event.
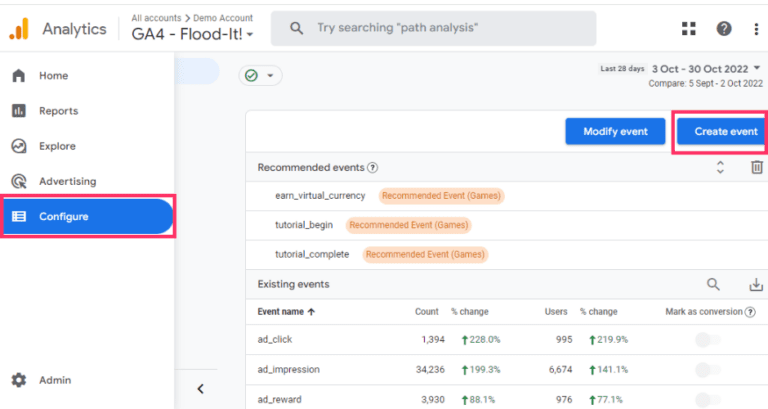
Name your event and set the condition so it triggers when a user visits the “thank you” page.
Click Create.
Go to Conversions. You should see your new event listed, toggle the slider to mark it as a conversion.
If it doesn’t appear right away, wait a little while and check back.
Once your conversion is ready, you can add a conversion value, but before that, you’ll want to import cost data if you’re running paid ads.
2. Import cost data from platforms
Bringing cost data into GA4 allows you to view campaign spend and revenue in one place. This helps you calculate ROI and ROAS across platforms.
In Google Analytics, go to Admin → Data Import.
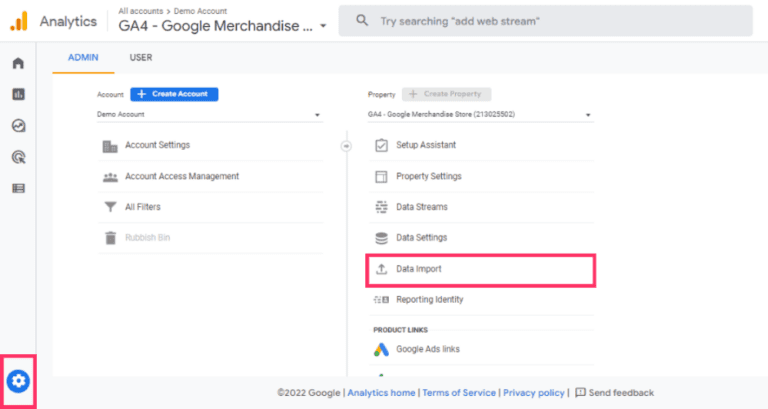
Click Create data source.
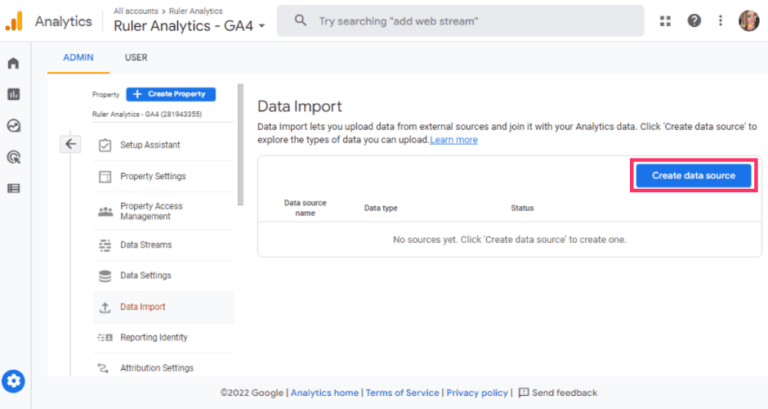
Choose Cost Data. You can either manually upload a CSV or try Google’s new automatic import (still in beta). For this example, use the manual option.
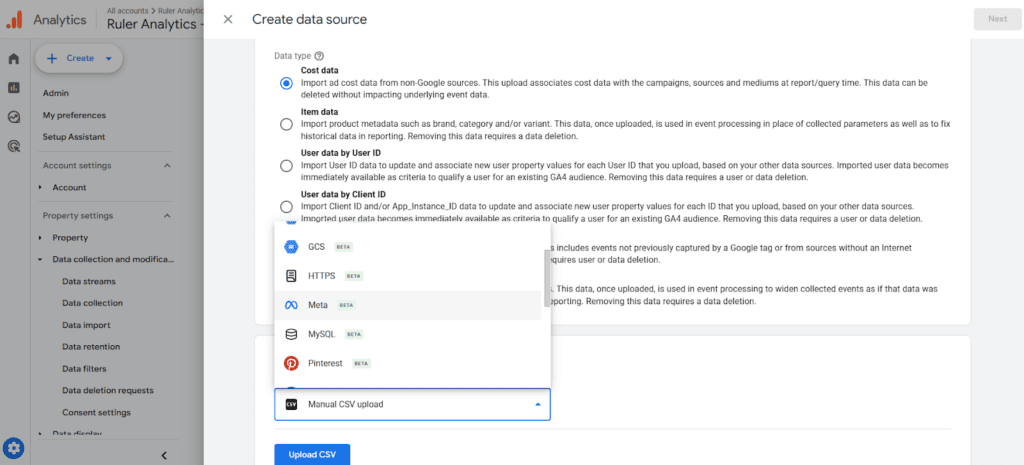
Name your data source.
Set up your data schema. Your CSV needs to include fields like date, medium, and source so GA4 can align the data. Google provides a template for this.
Upload your CSV, then map each field in your file to the correct one in GA4.
Click Import to upload your data.
When the import finishes, you’ll see a green tick under “Status.” It can take up to 24 hours before your cost data appears in reports, audiences, and explorations.
Conversion values help you calculate ROI. How you assign values depends on your business model.
3. Add values to conversions
Conversion values are important because, without them, it can be difficult to estimate the value of your ROI.

How you assign values depends on your business model.
1. For eCommerce: Platforms like Shopify or WooCommerce can automatically send purchase data (value, currency, and items) to GA4. The system then breaks down performance by channel, campaign, or landing page.
2. For lead generation: If your conversions come from predefined GA4 events, you can manually add values.
To add values, go to Configure → Create event and click the pencil icon to edit your event.
Scroll down and click Add modification.

Add two parameters:
currency → enter your code (e.g., GBP).
value → enter a figure, e.g., 50.
Click Save.
This assigns £50 to every lead that triggers that event. It’s a rough estimate, leads can have different values, and not all will become customers.
A more sophisticated method is to use a first-party data platform. One such tool is Ruler Analytics. It tracks UTMs, click IDs, referrers, and session data across the entire customer journey, from first interaction to conversion – online and offline.
It links these touchpoints to form fills, calls, chats, and eventual outcomes in your CRM or e-commerce platform.
You can pass actual closed revenue back to your first party data platform and attribute real customer value across touchpoints.
First-party tracking improves accuracy because you use your own verified sales data rather than rough estimates.
If you can’t use first-party stitching yet, you can use an estimated value to get directional insight. For example, ten leads produce one £1,000 sale.
Divide £1,000 by ten and assign £100 per lead. You will not collect £100 from every lead, but the figure reflects a 10% close rate and gives you a consistent way to compare channels.
With conversion values and imported cost data in place, you can calculate ROI and ROAS inside GA4 and see which campaigns deliver the best return. Use those insights to reallocate budget and focus on channels that drive revenue.
Why GA4 can’t accurately measure ROI
Google Analytics is the industry standard for measuring marketing performance. In fact, 91% of marketers say it’s their go-to reporting tool. It’s powerful for understanding website activity, traffic, engagement, conversions, but it falls short when it comes to connecting marketing to actual revenue and pipeline.
GA4 overlooks upper-funnel impressions
Google Analytics overlooks the influence of upper-funnel campaigns like display or brand awareness ads.
As a result, conversions often get over-attributed to channels like organic search or direct, which might only benefit from earlier exposure that came through Facebook or other display campaigns.
While Meta offers view-through attribution metrics, its 24-hour window rarely fits B2B buying cycles that stretch over weeks or months. The problem grows when you consider that Meta’s view-through data still depends on third-party cookies, which are becoming unreliable as browsers tighten privacy controls.
Cost data is often inaccurate
Another common issue lies in cost data. In GA4, cost data and analytics rarely line up perfectly. This misalignment often comes from:
- Incorrect linking between ad accounts and GA4
- Errors in manually importing cost data
- Differences in how platforms define key metrics such as sessions and clicks
Other frequent causes include mismatched time zones, missing GA4 tracking code on landing pages, and incorrect tagging setups. These inconsistencies distort ROI calculations and make it difficult to trust cost-per-conversion or return-on-ad-spend figures.
Conversion data is incomplete
GA4 was built to track digital behaviour, not the full customer journey. It doesn’t capture many offline touchpoints that influence deals, trade shows, direct mail, phone calls, in-person meetings, or CRM activity.
Because these are excluded from the data, GA4 undervalues channels that help create demand but don’t get the final click. That leads to over-investment in measurable digital channels and under-investment in offline activities that actually drive interest and relationships.
Limited attribution modelling
Google Analytics used to offer several rule-based attribution models. Those are now gone, leaving marketers with only last click and data-driven attribution.
Last click gives full credit to the final touchpoint, usually branded search or another bottom-funnel campaign. It ignores upper-funnel and mid-funnel efforts that nurture prospects long before conversion.
Even data-driven attribution in GA4 has its limits. Its 90-day attribution window is too short for many B2B sales cycles, which average about 102 days from lead to close.
That means part of the journey, sometimes the most influential part, is missing from your reports.
Google Analytics remains a valuable analytics tool, but it was never designed to show the full revenue impact of marketing. Understanding its blind spots helps you move toward more accurate, connected measurement, especially when combining GA4 with first-party data and CRM tracking.
How we measure ROI with unified marketing measurement
Given the limitations of Google Analytics, it’s clear it isn’t built to measure ROI accurately. Conversion values can help, but they don’t fully reveal which marketing efforts are driving revenue.
To understand what’s truly working, marketers need a unified, data-driven measurement approach, one that brings together multiple methodologies rather than relying on a single tool.
No one platform can give a complete answer. People see ads in one place and convert somewhere else. Privacy regulations are tightening, and customer journeys are getting longer, often beyond the attribution windows ad platforms and GA4 allow.
To overcome these gaps, we use a unified measurement framework that combines first-party tracking, machine learning models, and lift testing. Together, these methods connect marketing activity to revenue with far greater accuracy.
1. First-party multi-touch attribution
One of the biggest issues with Google Analytics is that it can’t track individual users. It anonymises data by assigning random IDs, which means marketers can’t see who a user is when they convert. Without that connection, it’s impossible to directly link marketing activity to revenue.
First-party multi-touch attribution closes this gap. By integrating tracking tags, CRM data, and ad platform inputs, you can capture and match every interaction, page views, UTM parameters, and conversion events, to a single customer identity (such as an email or phone number).
This creates a unified customer record showing the full journey from first touch to sale. When a visitor becomes a qualified lead or customer, their journey is linked to CRM or eCommerce data, allowing you to see how specific campaigns contribute to revenue.
In attribution tools like Ruler, this data can be fed back into the platform. Models can then be adjusted based on campaign goals, a first-click model for awareness activity or a linear model for consideration campaigns. Comparing models side-by-side shows which channels have the greatest influence across the funnel.
When this data syncs back to ad platforms, it improves targeting. Instead of broad retargeting, you can build audiences based on CRM stages or customer behaviour.
It also reduces duplication, ensuring that channels don’t overclaim credit for the same sale.
First-party MTA not only meets modern privacy standards but also gives marketers the clarity to link spend to revenue and make confident budget decisions.
2. Machine learning for impression and offline influence
Even the most robust first-party tracking can’t see everything. Some interactions, like ad impressions, TV, radio, or brand exposure, don’t generate direct clicks or measurable website activity.
Machine learning and marketing mix modelling fill these gaps. MMM takes a probabilistic approach, analysing aggregated data to estimate how different marketing activities contribute to revenue.
Using techniques such as multivariate regression, it assesses the relationship between inputs (media spend, pricing, promotions, seasonality) and outputs (sales, leads, revenue).
Machine learning also allows for forecasting. Through simulation, marketers can test how changes in budget allocation might impact ROI.
Diminishing returns curves highlight when additional spend stops delivering proportional results, helping avoid wasted budget.
Together with first-party attribution, MMM provides a fuller picture:
- First-party data links digital touchpoints to revenue.
- MMM accounts for impression-led, offline, and external factors.
This combination moves marketers beyond retrospective GA4 data, offering a connected view of discovery, engagement, and revenue performance.
3. Lift testing to validate models
While first-party attribution and MMM provide powerful insights, they’re both theoretical frameworks. Lift testing, also known as incrementality testing or randomised control trials, validates those models with real-world data.
Here’s how it works:
- Split your audience into two groups: test and control.
- Expose the test group to a campaign and withhold it from the control group.
- Measure the difference in outcomes between the two groups to calculate the incremental lift created by the campaign.
Lift testing is widely considered the gold standard for proving causality. Unlike attribution, which infers relationships, incrementality testing shows direct cause and effect, confirming whether marketing activity truly influenced conversions or if they would have happened anyway.
In practice, first-party MTA gives tactical insight at the campaign level. MMM provides the strategic, cross-channel perspective. And, Lift testing grounds both in causality and validates that your measurement reflects reality.
By combining these three methods, marketers can move beyond the limits of Google Analytics and build a measurement strategy that reflects how people actually buy.
The result is a clearer, more accurate view of ROI, one that connects spend, performance, and revenue in a single, unified framework.
Go beyond Google Analytics 4 ROI measurement
Measuring ROI is critical, but Google Analytics alone leaves gaps. GA4 tracks conversions and assigns values, yet it misses impressions, offline activity, and long B2B sales cycles. Cost data can be misaligned, and last-click attribution often overstates some channels while ignoring others.
A unified measurement approach solves these challenges. First-party multi-touch attribution connects users across channels to revenue, integrating CRM, eCommerce, and ad platform data.
Machine learning and marketing mix modelling estimate the impact of impressions, offline campaigns, and external factors, while lift testing validates the true causal effect of your marketing. Together, these methods provide a complete, accurate view of ROI.
Ruler simplifies this process by combining MTA and MMM in one platform. It links revenue to every touchpoint, integrates online and offline data, forecasts ROI, and validates campaigns with incrementality testing.
Book a demo with Ruler today to see how unified measurement can give you a complete, accurate view of your ROI and help you make smarter marketing decisions.